
Paradise, Nevada · Clark County
Excel Consulting Services in Paradise, NV
Paradise holds most of the Strip, the airport and the convention business, which gives the businesses here something almost nowhere else has: a demand calendar published years in advance. Very few of them have it anywhere in a spreadsheet. JAAD Group provides Excel consulting in Paradise for operators, suppliers and service firms whose forecasts are built from last year when the answer is already on a schedule.
- Forward-booking forecasts
- Variable labor cost models
- Customer concentration analysis
- Per-capacity reporting
Demand you can read in advance
Why Forecasting From Last Year Makes No Sense Here
In most towns a forecast has to be inferred, because nobody knows what next March looks like until it arrives. Here a very large share of demand is already determined: shows booked, conventions contracted, flights scheduled, room blocks held. The information exists outside the business and almost never makes it into the model.
So the standard forecast gets built the standard way — last year, adjusted — which quietly assumes next year's calendar resembles last year's. It frequently does not. A single large event moving, arriving or leaving changes a quarter, and a forecast built on history treats that change as a performance problem rather than as a known fact about the schedule.
The same calendar also determines when a business is capacity-constrained rather than demand-constrained, and those two states call for opposite decisions. Discounting into a week that will fill regardless is giving away margin; holding rate in a week that will not fill is giving away revenue. A model that cannot distinguish them will get one of those wrong every month.
Then there is compensation. A workforce paid substantially on tips, commission, service charge or incentive does not cost what an hourly model says it costs, and labor as a flat rate per hour is one of the most common sources of error in the files we see here.
What the work is really about
What Excel Consulting in Paradise Usually Comes Down To
The demand calendar is published and unused
Start with the calendar, because it is the largest single improvement available and it costs almost nothing to adopt. Convention dates, event schedules and flight capacity are published well ahead, and a forecast that carries them as an explicit driver is a fundamentally different instrument from one built by adjusting last year. The practical construction is straightforward: a calendar table holding each period's known demand signal, and a model that reads from it rather than from a growth assumption. Once that exists, a quarter that will be soft because a major event moved shows as soft in the plan rather than as a failure in the review, and the business gets months of warning instead of a month of hindsight. It is ordinary Excel consulting work with a disproportionate effect on every decision downstream.
Forward bookings beat history as an input
The second step is to use the business's own forward position, which is usually better information than anything external. Bookings on the books, contracts signed, blocks held and orders placed for future periods are a far stronger predictor than a trend line, and most operators have them recorded somewhere without ever using them as a forecast input. Building the pace view — what is on the books for a future period compared with what was on the books for the equivalent period a year ago at the same distance out — is the single most useful piece of Excel reporting available to a business in this market. It answers the only question that matters in advance: are we ahead or behind, and by how much.
Capacity-constrained and demand-constrained are opposite problems
Third, the distinction between being short of demand and being short of capacity has to be explicit in the model, because the correct response reverses between them. In a period that will sell out regardless, the lever is rate and mix; in a period that will not, it is volume and promotion. A model that reports only revenue against budget cannot tell the two apart, which is how a business ends up discounting into a sold-out week and holding firm through an empty one. Carrying a capacity figure alongside the demand figure, and reporting utilization rather than only revenue, makes the state of each period visible before the decisions get made.
Variable compensation makes labor cost non-linear
Fourth, compensation needs modeling as it actually behaves. Where a significant part of pay is tips, service charge, commission or incentive, the cost of an additional hour is not the posted rate, and the relationship between volume and labor cost is not a straight line. Models that treat labor as hours times a rate will therefore understate cost in strong periods and overstate it in weak ones, which is precisely backward for planning purposes. Separating the fixed component from the variable component, and tying the variable part to whatever actually drives it, produces a labor line that behaves like the real one. This is a modeling question rather than a payroll or compliance one — what must be paid is a matter for your own advisers.
One large customer can quietly be half the year
Fifth, concentration deserves to be measured rather than assumed. A supplier or service firm in this market can find that two or three accounts represent most of a year without anyone having stated it, because the reporting totals by month rather than by customer. Where that is the case, the business is carrying a risk it has never priced, and the first step is simply to produce the figure: revenue by customer, ranked, as a share of the total, with the trend across a few years beside it. It is a short piece of work and the conversation it starts is usually overdue.
This is a structuring job rather than a purchase
None of this calls for buying anything. The bookings, the contracts, the payroll detail and the sales history all exist; what is missing is a structure that treats a published calendar as data and a forward position as a forecast. That restructuring is measured in days, and an hour of Excel expert help is usually enough to establish how much of it you need.
What gets built
Excel Consulting Services in Paradise, NV — The Six Areas
Six kinds of work. For a business exposed to the event calendar, the first two are where almost every project starts.
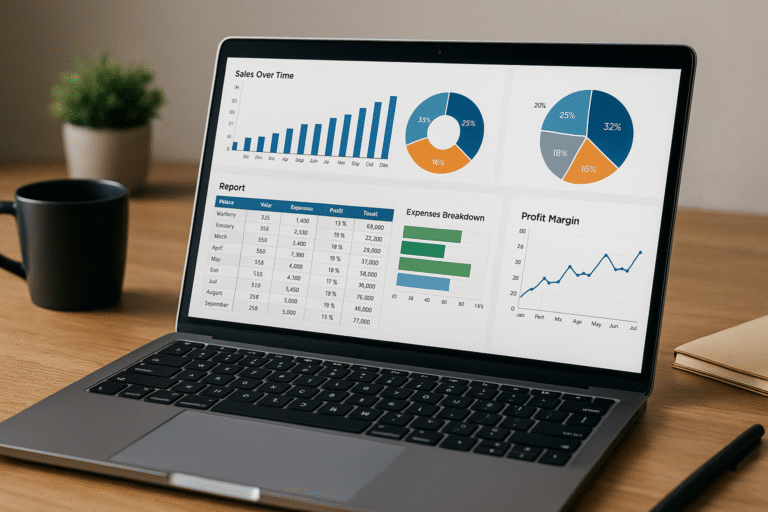
Reporting
Pace Reporting on the Forward Position
What is on the books for a future period against what was on the books a year ago at the same distance out. The one report that answers whether you are ahead or behind while there is still time to act.
- Pace by period at equivalent distance out
- Utilization reported alongside revenue
- Live connections to the systems already holding bookings
- Exception flags when a period falls out of pattern
Related: Excel reporting
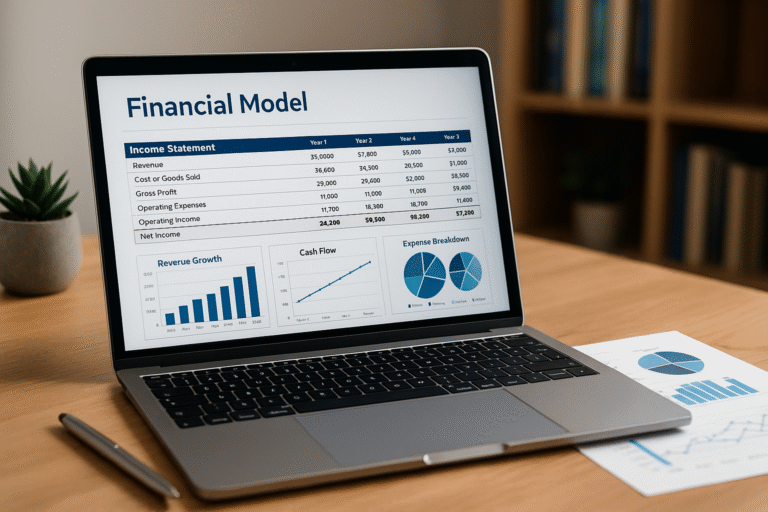
Modeling
Forecasts Driven by the Published Calendar
A calendar table holding each period's known demand signal, with the model reading from it rather than from a growth rate. A soft quarter then appears in the plan instead of in the review.
- Event calendar as an explicit driver, not an adjustment
- Capacity carried beside demand so the state of a period is visible
- Labor split into fixed and variable components
- Assumptions in one visible block, never inside formulas
Related: Excel financial modeling
Automation
Packs That Are Ready Before the Meeting
Anything reassembled by hand from the same systems every day or week is automation waiting to happen. Bookings, sales, labor and cost all arrive from the same places each time.
- Scheduled refresh so figures are current before decisions
- Multi-system consolidation across booking, POS and payroll exports
- Refresh from source rather than from a saved download
- Import cleanup for exports that shift format between runs
Related: Excel automation

Structure
Totaling by Customer, Not Only by Month
Concentration stays invisible while the reporting totals by period. Revenue by customer, ranked, as a share of the total, with the trend beside it, is a short job and an overdue conversation.
- Revenue by customer ranked and shown as a share
- Multi-year trend so a drift in concentration is visible
- Formula repair for references that stopped pointing anywhere
- Performance — volatile formulas replaced with tables and pivots
Related: Excel consulting

Code
VBA Where the Built-In Tools Run Out
Some sources will not come across cleanly, and some routines have to behave identically whoever runs them at six in the morning. That is what code is for.
- Deterministic routines for anything run every day
- Validated entry where figures are typed rather than imported
- Legacy macro repair where the author has moved on
- Add-ins so one shared tool updates in a single place
Related: VBA and macro development

Support
Expert Help and Team Training
Sometimes there is no project at all, only a pack that produced the wrong number an hour before it was needed. A call, your own file on screen, and the reasoning left behind in writing.
- Same-week attention when something has broken now
- Training on your own workbooks rather than sample data
- Written handover so tools outlive the people who built them
- Retained hours where there is no in-house Excel depth
Related: Excel expert help and MS Office training
Where it starts
Eight Conversations That Begin a Paradise Excel Project
Openings we hear from businesses exposed to this calendar, and what the answer usually turns out to be.
"A soft quarter gets treated as a failure."
When it was often a known fact about the schedule. A forecast that reads from the published calendar shows the softness months ahead rather than explaining it afterward.
"We have the bookings and we forecast from last year."
Which throws away the better information. Pace against the equivalent point a year ago is a far stronger predictor than any trend line.
"We discounted into a week that sold out anyway."
Because the report shows revenue against budget and not utilization. Carrying capacity beside demand makes the state of each period obvious before the decision.
"Labor always costs more than the model says in a good month."
Because the model treats pay as hours times a rate, and a large part of compensation here is variable. Splitting fixed from variable fixes the direction of the error.
"We think two accounts are most of the year."
Probably true and currently unmeasured, because the reporting totals by month. Revenue by customer ranked as a share of the total takes an afternoon to produce.
"The morning pack is assembled by hand every day."
From the same systems in the same order each time, which is exactly the condition automation needs. Built as a scheduled refresh it is ready before anyone arrives.
"Only one person can produce any of it."
A structural dependency rather than a staffing issue. Documentation and automation keep the reporting running through absence and turnover.
"The workbook takes a minute to recalculate."
Usually volatile functions across enormous ranges, or an array formula doing a pivot table's job. Rebuilt properly it is instant again with nothing anybody uses removed.
A quick check
Signs a Paradise Business Has Outgrown Its Reporting
Nobody plans this work. It happens after a quarter that was missed for reasons that were knowable, or a labor line that broke in a strong month. The earlier signals look like this:
- The event calendar is nowhere in the model
- Forecasts are built from history while bookings sit unused
- Reports show revenue and never utilization
- Labor is hours times a rate in a business paid partly on tips
- Nobody can state what share of revenue the top three customers are
- The daily pack is assembled by hand from the same sources each morning
- Figures arrive after the decision rather than before it
- One person is the whole process, and everybody knows it
What the current approach costs
The unused calendar costs in decisions rather than in hours. Staffing, stock and rate commitments all get made against a forecast that could have been months more accurate, and the gap only becomes visible as a variance that gets explained rather than avoided.
The labor error costs in both directions at once. Understated in strong periods and overstated in weak ones, it misprices exactly the decisions that depend on it, and the pattern is consistent enough to correct as soon as anyone looks.
What happens before a quote
The file gets examined alongside the routine around it — which systems feed it, who assembles it, and what gets corrected every period. Those recurring corrections mark the real fault more reliably than the formula anyone points to first.
Frequently the finding is that a pace report and a calendar table answer the whole complaint, and that is the recommendation. Where a spreadsheet genuinely is the wrong home for part of this, you will be told so plainly. The first conversation is free in either case.
Work delivered
Three Projects and the Figures the Clients Recorded
Real builds for real organizations. Each number came from the client once the tool had bedded into daily use.

66% better
accuracy
A budgeting tool across thirty companies
- Before
- A management company carrying thirty separate businesses budgeted each in isolation and consolidated by hand afterward, while several people needed different levels of access to one workbook.
- Built
- A budgeting template with security tiers, VBA rolling each approved budget into a master sheet, adjustable payroll, tax and benefits inputs, and a direct load into the accounting system.
- After
- Hand entry left the process entirely. Accuracy improved 66%, the build cycle ran more than ten times faster, and mid-year reforecasting became a practical option.

40 hours
a month back
Manual operations reporting replaced
- Before
- Reports for internal management and for external funding institutions were kept entirely by hand, with one update cycle running as long as three days.
- Built
- A program combining more than fifty sources into a single document in about five minutes, with each source checkable beforehand and drafts produced for comparison.
- After
- An eight-hour task now finishes in minutes, handing back at least forty person-hours each month from work that produced nothing new.

9 minutes
to 30 seconds
A workbook that had become unusable
- Before
- Locating one record inside a 1,200-row workbook could take nine minutes, the accumulated result of layered array formulas and years of unreviewed code.
- Built
- Data moved onto native Excel tables, pivot tables with slicers replaced the lookup logic, and the surplus VBA and array formulas were removed rather than worked around.
- After
- Thirty seconds for the same lookup on the same hardware. Structure had been the constraint all along, not processing power.
Sectors we work in
Industries We Serve in Paradise
The six areas JAAD Group covers, described as they present themselves around the Strip and the airport.

Retail and E-commerce
Inventory monitoring, sales tracking, profit calculations. Trade whose volume is set by a convention and event calendar published well in advance.

Finance and Accounting
Cash flow management, P&L tracking, budget analysis. Operations where a large share of compensation is variable and labor cost is not a straight line.

Manufacturing & Logistics
Supply chain analysis, production scheduling, vendor performance. Suppliers whose order pattern is dictated by customers much larger than themselves.

Real Estate & Construction
Investment models, cost forecasting, expense tracking. Contractors working around operating venues and fixed event dates.

Healthcare & Insurance
Patient record systems, policy tracking, compliance reports. Practices and benefits administrators serving a large shift-working population.

Education & Training
Enrollment reports, course progress dashboards, grant tracking. Training and university programs reporting on funder and academic calendars.
If your industry relies on Excel for financial analysis, data tracking or reporting, we can optimize and automate your workflows to save time and improve performance.

How it runs
Working With an Excel Consultant in Paradise
Five stages. The first is free, and a reasonable number of them end there with advice rather than a proposal.
Say what decision it has to inform
Not the spreadsheet but the choice it exists to support, and where it stopped supporting it. Sending the file makes the conversation much more useful, though nothing depends on it.
Audit the sources and the routine
Which systems feed it, who assembles it, and what gets corrected every period. Those repeated corrections usually mark the actual fault line.
A written scope and price
Both agreed before any building. The file has already been read by then, so leaving either open would be a choice rather than a necessity.
Build in the open
Working versions as they are produced rather than a single delivery at the end, because redirecting a build early costs almost nothing.
Hand over properly
The workbooks, macro source code, written documentation and training for the people who will run it every day.
Who does the work
Jeff Mattus
Owner & President, JAAD Group
JAAD Group is Jeff Mattus. He built the practice after more than twenty-five years of Excel and Office systems work, having come into it from Computer Science rather than from accounting, which is why a reporting problem gets treated as a structural question rather than a presentational one.
Those projects have covered finance, healthcare, technology and property. The spread is why a first call usually produces a diagnosis instead of a discovery phase: forward-booked demand has close structural relatives in order-book reporting across industries with no connection to hospitality.
For a business here the practical consequence is access. The person who answers the first call is the one who scopes the job and then builds it, so nothing is handed to somebody who was not part of the original conversation.
Organizations we have built for
Trusted With Business-Critical Spreadsheets














Why a specialist
Why Paradise Businesses Use a Dedicated Excel Consultant
One discipline, not a sideline
Excel, VBA and Office automation are the entire practice, which is why the diagnosis on a first call is usually right and the estimate close to the final figure.
Reshape before replacing
If the existing file can be restructured rather than rebuilt, that is the recommendation, and it is much the smaller invoice.
Built to use what you already know
A published calendar and a forward order book are better inputs than history, and most models here ignore both.
Documented on delivery
Written explanation, source code and training are part of handover, which matters in an industry with this much movement.
Results that were measured
Every outcome above was reported by the client in live use, and all three projects are set out in full further up this page.
Remote, and therefore quick
Screen share rather than scheduling, so something urgent gets attention the same day and no part of the fee is travel.
Questions
Frequently Asked Questions
What does Excel consulting in Paradise usually involve?
Most often it is rebuilding a forecast so it reads from the published event calendar and from your own forward bookings instead of from last year's figures. After that it is labor modeling, concentration analysis and automation.
The data is already there in every case. What changes is the structure, so information that exists months ahead actually reaches the decision.
Why is forecasting from last year a problem here specifically?
Because it assumes next year's calendar resembles last year's, and in this market that is often untrue in a way that moves a whole quarter.
A single large event arriving, moving or leaving is a known fact published well in advance. A model that carries it as a driver gives you months of warning rather than a month of hindsight.
We have bookings on the books. How should those be used?
As the primary forecast input, compared against the equivalent point a year earlier at the same distance out. That is what pace reporting means, and it is usually the most valuable report a business here can have.
It answers the question that matters while it can still be acted on: are we ahead or behind for a future period, and by how much.
How do we stop discounting into weeks that sell out anyway?
By reporting utilization alongside revenue so the state of each period is visible before rate decisions are made. A revenue-against-budget report cannot tell a sold-out week from an empty one.
Once capacity sits beside demand in the model, the lever to pull in any given period becomes fairly obvious.
Our labor cost never matches the model in a busy month. Why?
Because the model almost certainly treats pay as hours multiplied by a rate, and a substantial part of compensation here is variable rather than hourly.
Splitting the fixed component from the variable one and tying the variable part to what actually drives it corrects an error that currently runs in the wrong direction. What must be paid is a question for your own advisers; this is about how the cost behaves in a model.
Can a spreadsheet show customer concentration?
Easily, and it usually should. The reason nobody has the figure is that the reporting totals by month rather than by customer.
Revenue by customer, ranked, as a share of the total, with a multi-year trend beside it, is an afternoon's work and tends to start a conversation that was already due.
What does an Excel consultant charge?
It depends on scope, which is why the file is examined before any figure is named and why that examination is free. A pace report is small and fixed-price; a full calendar-driven model is priced as one piece of work.
In every case the deliverable and the price are written down before any building begins.
Do you work on site?
The work is delivered remotely and that is deliberate. Reviewing a workbook together on a shared screen is identical at any distance, and it means an urgent problem gets looked at the day it appears.
It also means no part of the invoice is travel time between here and anywhere else.
The analyst who built our model has left. Is that a problem?
It describes a lot of the work we do. The model gets read back to first principles, the fragile parts identified, and each one repaired or replaced depending on what is honestly warranted.
Their absence is not the obstacle. Time with whoever reads the output is, because agreeing what each figure is meant to represent is the part that takes real thought.
How long does this take?
A pace report is often a few days. A calendar-driven forecast with a proper labor split usually runs one to two weeks depending on what the audit finds. A staged build across several systems takes several weeks.
That estimate is committed in writing before build work starts rather than discovered along the way.
What do we receive at the end?
The workbooks, the macro source code, written documentation covering how everything operates, and training for the people who will use it daily.
Nothing is locked to us and no subscription is needed to keep it running. Support afterward is available and entirely optional.
Do you only work in those six industries?
No. They are simply where most of the work has landed rather than a restriction, and what decides scope is the nature of the problem rather than the sector.
A pace report, a labor model, a concentration analysis and a clinic rota are much more alike underneath than they appear from outside.
Also serving
Excel Consulting Across the Las Vegas Valley and Nevada
This is remote work, so your address has no effect on what gets delivered. Other places with pages of their own:
Straight to a service: Excel reporting for the pace view, financial modeling for the calendar-driven forecast, Excel automation for the daily pack, Excel consulting for concentration and structure, and VBA and macro development or Excel expert help for the rest.
Paradise is the hub here — schematic, not to scale
Send Us the Workbook
Describe the problem or attach the file. You will get a straight assessment of what is wrong and what putting it right involves, before anything is agreed.
949-464-7489JAAD Group Excel Consulting · 2937 Hawksdale Dr, Las Vegas, NV 89134
Excel consulting services in Paradise, NV and across the valley, delivered remotely