
Arvin, California · Kern County
Excel Consulting Services in Arvin, CA
On a farm around Arvin, headcount tells you almost nothing. Labor arrives as crews, often through a contractor, frequently paid by the piece, and the only figure that means anything is what the work cost per bin, per acre or per tray. JAAD Group provides Excel consulting in Arvin for growers and packers who need that number and cannot currently get it.
- Labor cost per bin
- Piece-rate crew tracking
- Harvest window planning
- Block-level costing
Crews, not employees
Why Headcount Is the Wrong Number on a Farm Here
Standard labor reporting assumes a stable workforce paid by the hour, and almost nothing about that describes a harvest. Crews arrive and leave, size varies day to day, a contractor may be between you and the people doing the work, and a good deal of it is paid by what gets picked rather than by how long it took.
What follows is that hours and headcount both become poor proxies for cost. The meaningful unit is output: cost per bin, per tray, per acre covered. That figure is comparable between blocks, between crews and between seasons, and it is the only one that answers whether a particular piece of ground is worth the work it takes.
The second difficulty is that the records to produce it sit in two places that rarely meet. The field side counts what came off the block; the office side holds what the contractor invoiced. Until those two share a block identifier and a date, no cost per bin exists, and every discussion about crew performance is anecdotal.
The third is timing. A block has a window, and the window is short. Labor, equipment and haulage all have to converge inside it, and when two blocks mature close together the problem is compression rather than capacity — the same resources needed in two places at once.
What the work is really about
What Excel Consulting in Arvin Usually Involves
Cost per bin replaces cost per hour
The first build is a labor cost per unit of output, and it is the figure almost every grower we speak to wants and does not have. It comes from dividing what the labor cost by what came off the block, which sounds trivial and is not, because the two numbers live in different records kept by different people for different purposes. Putting a block identifier and a date on both sides is the enabling step, and once it exists the comparisons become available immediately: this block against that one, this crew against another, this season against last. That is the single most useful piece of Excel consulting work available here, and it is usually a few days rather than a project.
Field counts and contractor invoices have to meet
Second, once cost per unit exists by block, the farm stops being the unit of management and the block does. Blocks differ in yield, in how hard they are to work, in how far they are from the shed and in how they respond to a given input, and a whole-farm average flattens all of that into a figure that describes no actual ground. Reported by block, the pattern is usually stark — a handful of blocks carrying the operation and one or two consistently costing more than they return. Those are real decisions about replanting, leasing out or changing what is grown, and they cannot be made from an average.
A block is the unit, not the farm
Third, the harvest calendar needs modeling as a compression problem. Each block has a window determined by the crop rather than by the schedule, and the windows overlap. When two blocks come ready within days of each other, the question is not whether there is enough labor in total but whether there is enough in that fortnight, and the cost of getting it wrong is either fruit left too long or a premium paid for crews at short notice. Laying the windows out against available crew capacity, as a plan rather than as a recollection, turns a recurring scramble into something decided weeks earlier. It is a straightforward piece of financial modeling with the whole season riding on it.
Harvest windows overlap and compress
Fourth, piece rates deserve checking against what they actually produce. A rate that looked right at one yield level behaves differently at another, because the amount a crew can pick per hour changes with how heavy the block is. That means the same rate can be generous on a strong block and punishing on a thin one, and neither outcome is intended. Tracking rate against realized yield per block makes the relationship visible and lets rates be set with that in mind, which is better for the operation and for the crews. Questions of what must be paid and how belong with your own advisers; the spreadsheet's job is to show what the arrangement is actually producing.
Piece rates need checking against yield
Fifth, this is all seasonal, which means the reporting has to survive a year of not being used. A workbook built in a rush during one harvest and abandoned afterward will be unusable by the next, because nobody remembers the conventions. Written documentation, validation that refuses a bad entry and a structure obvious enough to pick up cold are worth more here than in a business that uses its systems daily, and that is why training on your own files forms part of handover rather than being an extra.
This is a records problem, not a software one
None of this calls for buying software. The bin tickets, the contractor invoices, the block maps and the yield records all exist; they are kept separately, which is exactly why the cost per bin cannot be produced. Getting them onto a shared block-and-date structure is days of work, and an hour of Excel expert help will usually establish how much of it you need.
What gets built
Excel Consulting Services in Arvin, CA — The Six Areas
Six kinds of work. For a grower or packer the first two are where nearly every project starts.

Structure
Getting to a Cost Per Bin
A block identifier and a date on both the field counts and the contractor invoices. That one change is what makes a cost per unit of output possible at all.
- Shared block and date across field and office records
- Cost per bin, tray or acre rather than per hour
- Formula repair for references that stopped pointing anywhere
- Performance — volatile formulas replaced with tables and pivots
Related: Excel consulting
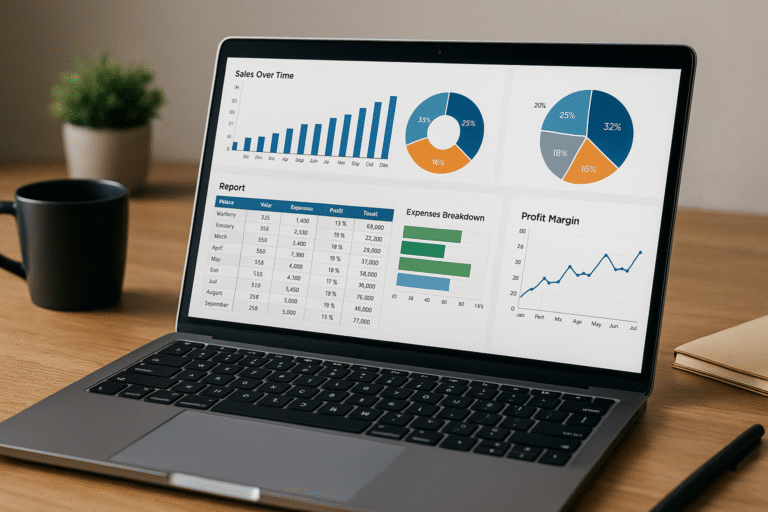
Reporting
Reporting by Block, Not by Farm
Blocks differ in yield, in difficulty and in distance. A whole-farm average flattens all of it into a figure that describes no actual ground.
- Cost and yield by block, compared directly
- Crew comparison on the same basis across blocks
- Season against season for the same ground
- Exception flags when a block falls out of its own pattern
Related: Excel reporting
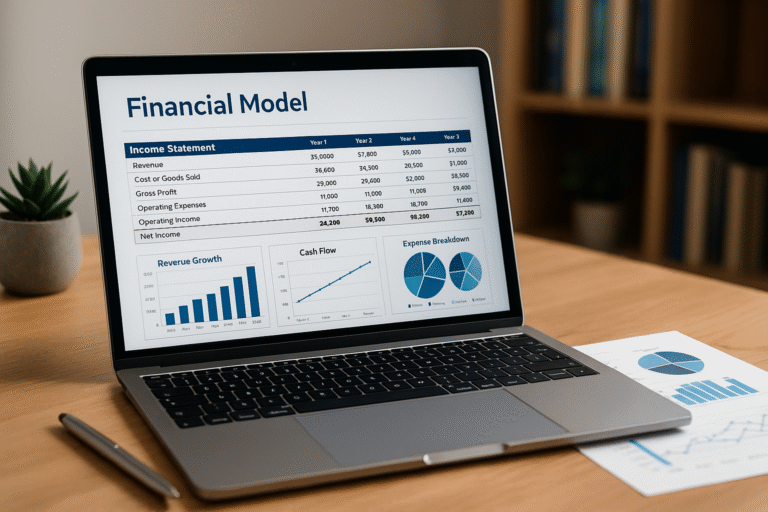
Modeling
Planning the Compression, Not the Total
Windows laid out against crew capacity, so two blocks maturing days apart is a decision taken weeks earlier rather than a scramble taken on the morning.
- Windows against capacity rather than annual totals
- Overlap identified early while options still exist
- Cost of short-notice crews made explicit
- Assumptions in one visible block, never inside formulas
Related: Excel financial modeling
Automation
Bringing the Season's Paper Together
Bin tickets, invoices and yield records arrive from different directions in a short, busy period. Imported on a schedule, the cost per bin is current during harvest rather than after it.
- Scheduled imports through the harvest period
- Import cleanup for tickets and invoices in varying formats
- Running season totals so a problem shows up in week two
- Exception reporting on blocks that are drifting
Related: Excel automation

Code
VBA for Entry That Happens in the Field
Counts recorded during a harvest are entered fast, by tired people, often from paper. The form has to refuse an impossible value and take seconds rather than minutes.
- Fast entry forms built for seconds per ticket
- Block validated at the keyboard so a count cannot be misfiled
- Repeatable routines for the daily and weekly close
- Legacy macro repair where whoever wrote it has gone
Related: VBA and macro development

Support
Expert Help and Team Training
Often there is no project, only a sheet that has to work by the end of the week because harvest has started. One call, your own file shared across, and the reasoning written down.
- Same-week attention when the season will not wait
- Training on your own file rather than on sample data
- Written handover so it can be picked up cold next season
- Retained hours where there is no in-house Excel depth
Related: Excel expert help and MS Office training
Where it starts
Eight Conversations That Begin an Arvin Excel Project
Openings we hear from growers and packers, and what the answer usually turns out to be.
"I cannot tell you what a bin costs to pick."
Because the count and the invoice live in separate records. A shared block identifier and date on both sides makes the figure available, usually within a few days of work.
"Some blocks feel expensive and I cannot prove it."
A whole-farm average hides it by design. Reported by block, the ones costing more than they return are normally obvious inside one season.
"Headcount is in every report and tells me nothing."
Correct, because crews vary in size and much of the work is paid by the piece. Output is the unit that makes labor comparable at all.
"Two blocks came ready in the same week and it cost me."
Compression rather than capacity. Windows laid against crew availability turn that into a decision made weeks earlier instead of on the morning.
"The same piece rate works on one block and not another."
Because what a crew can pick per hour depends on how heavy the block is. Tracking rate against realized yield shows the relationship rather than leaving it to chance.
"Last season's workbook makes no sense to me now."
Common with seasonal tools. A structure that can be picked up cold, with validation and written notes, is worth more here than in a business using its files daily.
"Only one person can produce any of the numbers."
A structural dependency, and a sharp one when that person is also needed in the field. Documentation and automation keep it running regardless.
"The file has slowed right down."
Usually volatile functions across large ranges, or an array formula doing a pivot table's job. Rebuilt properly it is quick again and nothing anybody relies on is lost.
A quick check
Signs a Growing Operation Has Outgrown Its Records
Nobody plans this. It happens after a season that cost more than it should have, or when a replanting decision needs a figure nobody has. Earlier signals look like this:
- No cost per bin, tray or acre exists anywhere
- Field counts and invoices are never joined
- Reporting is whole-farm rather than by block
- Headcount appears where output should
- Harvest windows live in memory rather than in a plan
- Piece rates are set without reference to block yield
- Last season's file cannot be understood this season
- You have priced farm software before anyone joined the records
What the missing figure costs
The block decision is the big one. Ground that consistently costs more to work than it returns stays in production for years because the average never shows it, and the cost of that is measured in seasons rather than in dollars per bin.
The compression cost is sharper and more immediate. Crews booked at short notice because two windows collided carry a premium, and the alternative — fruit left a few days too long — costs on the other side of the ledger. Both are avoidable with a plan drawn up weeks earlier.
What happens before a quote
We look at how the season is recorded as much as at the file — what the field writes down, what the office receives, and where the two stop lining up. The pieces of a cost per bin are almost always present and simply never joined.
Frequently the answer is that joining those two records settles the whole question, and that is the recommendation. Where part of this genuinely needs something other than a spreadsheet, you will be told so. The opening conversation is unpaid either way.
Work delivered
Three Completed Builds and Their Results
Genuine projects for real organizations. Each number was reported by the client once the tool had been running for a while.

66% better
accuracy
A shared budget tool for thirty companies
- Starting out
- A management company carried thirty separate businesses, each budgeting alone and consolidated afterward by hand, while several people each needed a different level of access to one workbook.
- Delivered
- A template with tiered permissions, VBA moving each approved budget into a master sheet, payroll, tax and benefits adjustable from the front, and the totals loading straight into the accounting system.
- Result
- Double entry disappeared from the process. Accuracy rose by 66%, the build cycle ran more than ten times quicker, and reforecasting mid-year became a practical option.

40 hours
a month back
Hand-built reporting automated
- Starting out
- Reports for internal management and for external funding institutions were built entirely by hand, with one refresh cycle running as long as three days.
- Delivered
- A program drawing over fifty sources into a single document in roughly five minutes, with each source checkable beforehand and drafts produced for comparison.
- Result
- A task that had occupied a full working day now finishes in minutes, returning at least forty person-hours each month from work that produced nothing new.

9 minutes
to 30 seconds
A workbook that had stopped being usable
- Starting out
- Retrieving one record from twelve hundred rows could take nine minutes, the product of array formulas layered on each other and years of code added without review.
- Delivered
- The data moved onto native Excel tables, pivots and slicers replacing the lookup logic, and the redundant array formulas and VBA taken out rather than worked around.
- Result
- Thirty seconds for the same record on the same hardware. Structure had been the constraint all along, never processing power.
Who this applies to
Industries We Serve in Arvin
The six areas JAAD Group covers, described as they appear in the southern San Joaquin Valley.

Manufacturing & Logistics
Supply chain analysis, production scheduling, vendor performance. Packing, cooling and haulage that all have to converge inside a short window.

Finance and Accounting
Cash flow management, P&L tracking, budget analysis. Operations whose whole year's result is decided in a few weeks of labor cost.

Real Estate & Construction
Investment models, cost forecasting, expense tracking. Land, planting and infrastructure decisions that need a per-block figure to make sense.

Retail and E-commerce
Inventory monitoring, sales tracking, profit calculations. Direct and wholesale sales where grade and pack size change the economics.

Healthcare & Insurance
Patient record systems, policy tracking, compliance reports. Clinics and administrators serving a largely agricultural workforce.

Education & Training
Enrollment reports, course progress dashboards, grant tracking. Training and safety programs reporting on an outside format.
If your industry relies on Excel for financial analysis, data tracking or reporting, we can optimize and automate your workflows to save time and improve performance.

How it runs
Working With an Excel Consultant in Arvin
Five stages. There is no charge for the first, and a decent share of jobs stop there with advice rather than a quote.
Say which figure is missing
The number the season needs and cannot produce. Sending whatever the field and the office each keep makes the call far sharper, though it is not required.
We look at both sets of records
What the field writes down, what the office receives, and where the two stop lining up. That gap is almost always where the answer is.
Scope and figure agreed first
Both on paper before construction. The records have been read by then, so leaving either vague would be a decision rather than a necessity.
Built where you can see it
Each working version reaches you as it is finished rather than everything at the end, which is what makes an early change inexpensive.
Handed over for next season
The workbooks, any code, a written account of the conventions used, and time with whoever will pick it up cold in twelve months.
Who does the work
Jeff Mattus
Owner & President, JAAD Group
JAAD Group is Jeff Mattus working alone. He built the practice across more than twenty-five years of Excel and Office systems work, having come into it through Computer Science rather than through accountancy. Where two sets of records kept for different purposes have to be joined, that is the background that makes it possible.
Those projects have run through finance, healthcare, technology and property. The breadth is why an opening call usually produces a diagnosis rather than a discovery phase: a cost-per-unit join has close relatives in production reporting across industries with no fields in them.
Everything is delivered remotely, which is how a Kern County operation works with a practice based in Nevada without that mattering. One person takes the call, prices the job and then builds it.
Organizations we have built for
Trusted With Business-Critical Spreadsheets














Why a specialist
Why Arvin Growers Use a Dedicated Excel Consultant
A single discipline
Excel, VBA and Office automation are the whole practice, which is why an opening diagnosis is usually right and the estimate close to the final figure.
Join the records before buying
Farm management packages are sold hard here. The bin tickets and the invoices you need already exist and simply are not joined.
Built for output, not headcount
Where crews vary and much is paid by the piece, cost per bin is the only comparable unit there is.
Made to survive a year unused
Seasonal tools get abandoned and picked up cold. Documentation and validation matter more here than a dashboard does.
Numbers the clients reported
Each outcome quoted above came from the organization using the tool, and all three builds appear at length earlier on this page.
Remote, so nothing waits
Everything happens over a shared screen. During harvest that means a problem is looked at the same day rather than next week.
Questions
Frequently Asked Questions
What does Excel consulting in Arvin usually involve?
Most often it is joining the field's bin counts to the contractor's invoices so a cost per bin exists, then reporting that by block rather than across the whole farm.
After that it is harvest window planning and checking piece rates against realized yield. All the underlying records exist; they are simply kept apart.
Why can we not get a cost per bin now?
Because the two halves of the calculation are kept by different people for different reasons. The field counts what came off; the office holds what was invoiced.
Putting a block identifier and a date on both sides is the enabling step, and it is usually a few days of work rather than a project.
Why report by block instead of by farm?
Because blocks are not alike. They differ in yield, in how hard they are to work and in how far they are from the shed, and an average describes none of them.
Reported individually, a handful of blocks usually turn out to be carrying the operation while one or two cost more than they return. Those are real decisions.
Can a spreadsheet help with overlapping harvest windows?
That is one of the better uses for it. The problem is not total labor across a season but labor inside a fortnight when two blocks come ready together.
Laying the windows against available crew capacity turns the usual scramble into a decision taken weeks earlier, while options are still open.
Our piece rate works on some blocks and not others. Why?
Because what a crew can pick per hour depends on how heavy the block is, so the same rate is generous on a strong block and hard on a thin one.
Tracking rate against realized yield makes that visible so rates can be set with it in mind. What must legally be paid is a question for your own advisers.
Our workbook is rebuilt every season. Can that stop?
It usually can, and the reason it happens is that the original was built in a hurry and never documented, so by the next harvest nobody trusts it.
A structure that can be picked up cold, with validation and written notes on the conventions, is the fix. That is why training on your own file is part of handover.
What will this cost?
Scope decides it, which is why the records are read before any figure is named and why that reading is free. Joining the two records is small and fixed-price; a full season model is priced as one job.
Either way the deliverable and the price are both written down before construction begins.
Do you come out to the ranch?
No. Everything is done over a shared screen, which works the same at any distance and means something urgent during harvest gets looked at the same day.
It also keeps travel off the invoice, which out here would not be a small line.
The person who set up our records has left. Can you work with them?
Routinely. The file is taken apart down to its logic, whatever is only just holding is marked, and each part mended or rebuilt according to what it genuinely needs.
Getting them back is not the help. Time with whoever reads the figures is, because settling what each number is meant to represent is the demanding part.
How long is this likely to take?
Joining the field and office records to produce a cost per bin is often a few days. Adding block reporting and a window plan usually runs one to two weeks.
However large the job, that figure goes on paper before construction rather than surfacing partway through.
What stays with us?
The workbooks, any code behind them, a written description of the conventions and of each moving part, and time with whoever will run it next season.
Nothing depends on us afterward and no recurring charge keeps it alive. Further help exists on request and is never a condition.
Are those six sectors a restriction?
No. They describe where enquiries have tended to come from rather than what is accepted, and what settles it is the shape of the problem.
A cost per bin, a window plan, a yield comparison and a clinic rota are considerably more alike underneath than they look from outside.
Also serving
Excel Consulting Across California and Nevada
The work happens over a shared screen, so a California operation is served exactly as a Nevada one is. Other places with their own pages:
Straight to a service: Excel consulting for the cost per bin, Excel reporting for block comparison, financial modeling for harvest windows, Excel automation for the season imports, and VBA and macro development or Excel expert help for the rest.
Arvin is the hub here — schematic, not to scale
Send Us the Workbook
Say which figure the season cannot produce, or attach what the field and the office each keep. You get a flat read on the problem and what joining it up would take, with nothing agreed at that point.
949-464-7489JAAD Group Excel Consulting · 2937 Hawksdale Dr, Las Vegas, NV 89134
Excel consulting services in Arvin, CA and across California, delivered remotely