
Excel consulting for Arcata and Humboldt CountyCall 949-464-7489

Arcata, California · Humboldt County

Excel Consulting Services in Arcata, CA

Two facts govern business arithmetic in Arcata. The year runs on an academic calendar rather than a fiscal one, so revenue arrives and disappears on dates nobody local chose. And the nearest large market is hours of freight away, which puts a floor under what anything costs to get here. JAAD Group provides Excel consulting in Arcata for the workbooks that have to live with both.

  • Academic-calendar forecasting
  • Landed cost models
  • Lead-time and stock planning
  • Seasonal labor models
25+Years building Excel and Office systems for businesses
40+Person-hours a month returned on one reporting rebuild
1700Faster record retrieval after a workbook was restructured
66Improvement in budgeting accuracy across thirty entities

Somebody else's calendar

A Trading Year That Starts in August and Empties in May

Most businesses can at least pretend their year is divided into twelve comparable months. Here it is not. Term dates, move-in weekends, breaks and commencement set the shape of demand, and the gaps between them are not quiet periods so much as different periods, with the same rent and a fraction of the customers.

Reporting built on months therefore describes something that does not happen. September and February are both term-time and are not comparable to each other; June and September are both months and have almost nothing in common. A variance report organized by calendar month in this town is mostly measuring where the term boundaries fell.

The second fact is distance. Everything arriving here has traveled a long way, which means freight is a material component of landed cost rather than a rounding line, and it moves independently of the price of the goods themselves. A cost model that tracks unit price and absorbs freight into overhead is missing the part that actually varies.

The third follows from the second: lead times are long enough that stock decisions are forecasts. Ordering here is a commitment made weeks before the demand it is meant to serve, which turns inventory from an operational matter into a planning one.

A variance report organized by calendar month in this town is mostly measuring where the term boundaries happened to fall.

What the work is really about

What Excel Consulting in Arcata Usually Involves

The reporting period has to match the term, not the month

The first change worth making is to the reporting period itself. Where demand is set by an academic calendar, the useful comparison is term against equivalent term and break against equivalent break, not month against month. That means holding a calendar table that maps each date to a period type — term, break, move-in, commencement — and reporting against it. The same sales records then produce comparisons that mean something, and a soft week can be read as a calendar effect rather than as a performance failure. It is a data structure change rather than new data collection, and it is the single highest-value piece of Excel reporting work available to a business in this town.

Summer is a different business paying the same rent

Second, the summer deserves treating as its own business rather than as a weak quarter. Its revenue has a different source, its cost base is largely unchanged, and the decisions it calls for are different: what to close, what to reduce, what to keep staffed and what to pay for out of term-time surplus. Modeled as a separate period with its own revenue and cost assumptions, the question becomes answerable — how much of the summer shortfall has to be funded from the preceding terms, and therefore what the business can afford to commit to in September. Averaged into an annual figure, that question cannot even be asked properly. This is straightforward financial modeling with an immediate effect on autumn decisions.

Freight puts a floor under every landed cost

Third, landed cost needs breaking apart. For a business this far from its suppliers, the price of an item and the cost of getting it here move independently, sometimes in opposite directions, and a model carrying only one of them will misprice consistently. Separating unit price, freight, handling and any minimum-order effects into their own components gives a landed cost that can be explained and, more usefully, a view of where a saving might actually exist. Frequently it turns out not to be in the unit price at all but in order size or consolidation, which is a conclusion that cannot be reached while freight sits inside a general overhead rate.

Long lead times turn ordering into forecasting

Fourth, the lead time problem should be handled as forecasting rather than as replenishment. Where an order placed today arrives weeks from now, the reorder decision is a bet on demand in a future period, and the useful tool is not a minimum stock level but a projection: expected demand over the lead time, plus a buffer sized from how variable that demand has actually been. Built properly it tells you what to order and when, and it tells you the cost of being wrong in each direction, which is the figure that determines how large the buffer should be. The arithmetic is not difficult; what is usually missing is the structure to hold demand history by period type rather than by month.

A labor pool that turns over with the terms

Fifth, the labor pool turns over with the academic year, and that has a practical consequence for how tools should be built. A workbook that depends on knowing which cell must not be overwritten works for as long as the person holding that knowledge stays, and here that can be a matter of terms rather than years. Validation at the point of entry and written documentation are worth considerably more in that environment than any dashboard, and training on the actual files rather than on sample data is part of delivery rather than an extra. It is also why a certain amount of VBA is usually justified here: code is what makes a process behave the same way for a new starter as for the person who left.

Structure is the gap here, not software

None of this needs software bought. The sales history, the supplier invoices with their freight lines, the order records and the calendar all exist already, held in a shape that makes the comparisons meaningless and the ordering decisions guesses. Restructuring is days of work, and an hour of Excel expert help will usually establish how much of it you need.

What gets built

Excel Consulting Services in Arcata, CA — The Six Areas

Six kinds of work. For a business running on an academic calendar, the first two are where almost every project begins.
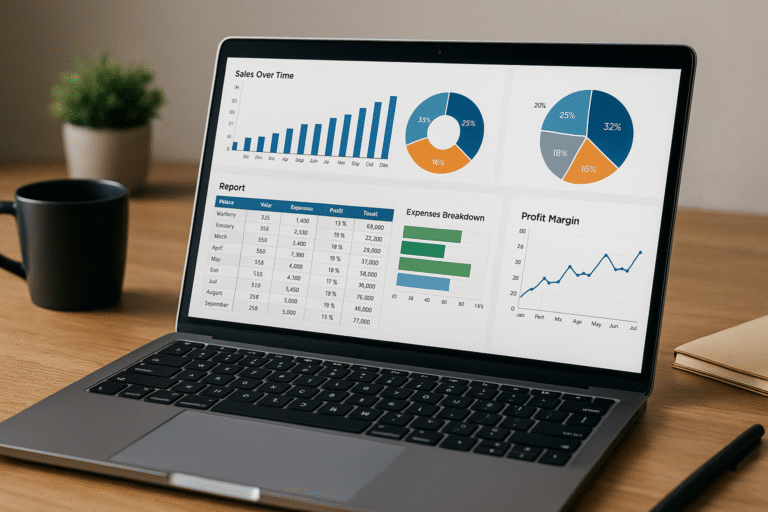
Excel report comparing term periods rather than calendar months Reporting

Reporting by Term, Not by Month

A calendar table mapping each date to a period type, with reporting built against it. The same records then produce comparisons that mean something instead of measuring term boundaries.

  • Term against equivalent term, break against break
  • Calendar effects separated from performance
  • Live connections to the systems already holding sales
  • Exception flags when a comparable period moves

Related: Excel reporting
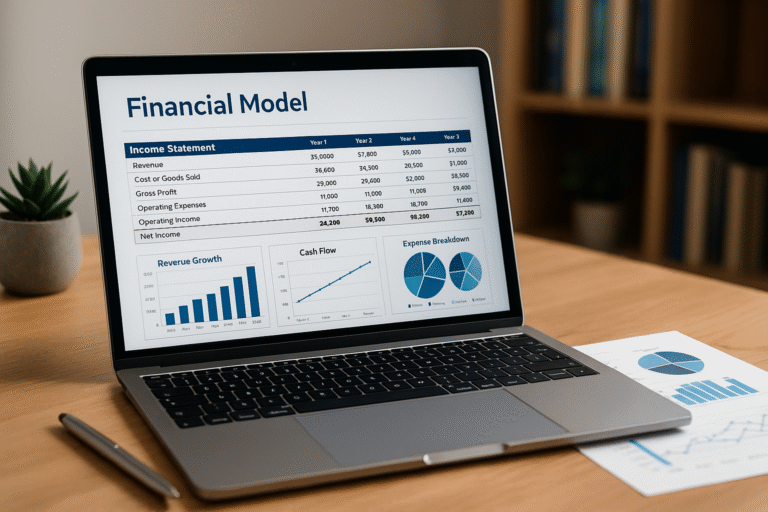
Excel model treating summer as a separate business period Modeling

Summer Modeled as Its Own Period

Different revenue source, largely unchanged cost base. Modeled separately, you can answer how much of the summer has to be funded from the preceding terms — and what September can commit to.

  • Period-specific assumptions rather than an annual average
  • Funding requirement for the gap, sized not guessed
  • Scenario switching for a weak term or a late start
  • Assumptions in one visible block, never inside formulas

Related: Excel financial modeling

Excel consultant separating unit price from freight in a landed cost model Structure

Breaking Landed Cost Into Its Parts

Unit price, freight, handling and minimum-order effects as separate components. The saving is frequently in order size rather than in the price, which is invisible while freight sits in overhead.

  • Freight as its own component, not absorbed into overhead
  • Order-size effects made visible and comparable
  • Formula repair for references that stopped pointing anywhere
  • Performance — volatile formulas replaced with tables and pivots

Related: Excel consulting

Automated reorder projection built in Excel for long lead times Automation

Reorder Projections Instead of Minimum Levels

Expected demand across the lead time with a buffer sized from how variable that demand has been. It tells you what to order, when, and what being wrong costs in each direction.

  • Lead-time demand projected rather than a static minimum
  • Buffer sized from actual variability, not a rule of thumb
  • Scheduled refresh from sales and supplier records
  • Import cleanup for invoices and exports that shift format

Related: Excel automation

VBA entry form built so a new seasonal starter cannot enter bad data Code

VBA for a Workforce That Turns Over

Where staff change with the terms, code is what makes a process behave the same way for a new starter as for the person who left. Entry that validates, routines that do not depend on memory.

  • Entry forms refusing a wrong value at the keyboard
  • Deterministic routines for anything done every week
  • Legacy macro repair where the author has moved on
  • Add-ins so a shared tool updates in one place

Related: VBA and macro development

Remote Excel expert help session with a Humboldt County business Support

Expert Help and Team Training

Often there is no project, only a file that stopped adding up in the week before term starts. A single conversation, your file shared across the screen, and a written explanation left with you.

  • Same-week attention when something has broken now
  • Training on your own files rather than on sample data
  • Written handover so a tool survives seasonal turnover
  • Retained hours where there is no in-house Excel depth

Related: Excel expert help and MS Office training

Where it starts

Eight Conversations That Begin an Arcata Excel Project

Openings we hear from businesses on this calendar, and what the answer usually turns out to be.

"Month-on-month comparisons tell us nothing."

Because the periods are not comparable. Mapping each date to a period type and comparing term against term produces a variance report that is actually about trading.

"Summer looks like the business is failing."

It looks that way because it is being judged against term-time. Modeled as its own period with its own assumptions, the question becomes how much of it to fund rather than what went wrong.

"We track prices and freight just happens."

Which means the component that actually varies is invisible. Separated out, the available saving frequently turns out to be in order size rather than in the unit price.

"We order by feel because delivery takes weeks."

Then the reorder point is a forecast whether or not it is treated as one. Projecting demand across the lead time with a sized buffer replaces the feel with a number.

"Every new starter breaks something."

A sign the process depends on knowledge rather than structure. Validation at entry and written documentation convert that knowledge into something the workbook enforces itself.

"We cannot tell which lines sell in term and which sell in summer."

Because the reporting totals by month. Once period type is a dimension in the data, that split takes a pivot table rather than a project.

"Only one person can produce the numbers."

A structural dependency, and a sharper one where staff turn over with the academic year. Documentation and automation keep the reporting working through a change of staff.

"The workbook has got slow and awkward."

Usually volatile functions across large ranges, or an array formula doing a pivot table's job. Put back together properly it moves fast again and no feature anyone leans on disappears.

A quick check

Signs an Arcata Business Has Outgrown Its Spreadsheet

Nobody plans this work. It follows a summer that was worse than expected, a stock commitment that arrived after the demand, or a new starter who broke the file. The earlier signals look like this:

  • Reporting is monthly in a business whose year runs on terms
  • Summer is judged against term-time and always looks like failure
  • Freight is absorbed into overhead rather than costed per item
  • Reorder points are a feel rather than a projection
  • Nobody can split sales by term and break
  • A new starter can overwrite a formula without being stopped
  • Nothing is documented and staff change every year
  • You have priced new software without anyone auditing the file

What this costs already

The ordering error is the visible one. With long lead times, a commitment made on instinct either arrives late for the demand it was meant to serve or sits as stock through a period with no customers, and both outcomes cost real money in a business with this cost base.

The comparison problem costs in decisions rather than in cash. While a soft week cannot be distinguished from a calendar effect, every operational response is a guess, and the ones that happen to work get repeated for the wrong reason.

What happens before a quote

The file gets examined alongside the routine around it — who enters what, which figures get corrected each period, and which steps depend on remembering something first. Those remembered steps are usually where the fault actually lives.

Frequently the finding is that a calendar table and a term-based report answer the whole complaint, and that is the recommendation. Where a spreadsheet genuinely is the wrong home for part of this, you will be told so. Either way nothing is charged for that first discussion.

Work delivered

Three Finished Builds and Their Effect

Real builds for real organizations. Each figure was reported by the client once the tool had settled into use.

Excel budgeting template with tiered access across thirty companies

66% better
accuracy

A budgeting tool for thirty companies

The position
Thirty separate businesses under one management company, each budgeting on its own and consolidated by hand afterward, with several people needing different levels of access to a single workbook.
The build
A budgeting template with security tiers, VBA rolling each approved budget into a master sheet, adjustable payroll, tax and benefits inputs, and a direct load into the accounting system.
The outcome
Manual entry left the process entirely. Accuracy improved by 66%, the build cycle ran more than ten times faster, and reforecasting part-way through the year became realistic.

Automated report consolidating over fifty separate sources

40 hours
a month back

Operations reporting taken off manual

The position
Reports for internal management and for outside funding institutions were maintained by hand, with a single update cycle running up to three days.
The build
A program drawing more than fifty sources into one document in roughly five minutes, with each source inspectable beforehand and drafts produced for comparison.
The outcome
An eight-hour job now finishes in minutes, returning at least forty person-hours a month from work that produced nothing new.

Workbook rebuilt onto native Excel tables with pivot tables and slicers

Nine minutes
to thirty seconds

A workbook that had stopped working

The position
Retrieving one record from a 1,200-row workbook could take as long as nine minutes, the result of layered array formulas and years of code added without review.
The build
Data moved onto native Excel tables, pivot tables with slicers replacing the lookup logic, and the redundant VBA and array formulas removed rather than worked around.
The outcome
Thirty seconds for the identical retrieval on identical hardware. The limitation had always been structure rather than processing power.

Who this applies to

Industries We Serve in Arcata

The six areas JAAD Group covers, described as they appear on the north coast.

Retail and E-commerce icon

Retail and E-commerce

Inventory monitoring, sales tracking, profit calculations. Trade that arrives and disappears with the academic year, ordered weeks ahead of the demand.

Education and Training icon

Education & Training

Enrollment reports, course progress dashboards, grant tracking. Programs reporting to funders whose periods and categories never match the internal ones.

Manufacturing and Logistics icon

Manufacturing & Logistics

Supply chain analysis, production scheduling, vendor performance. Operations where freight distance puts a floor under every landed cost.

Finance and Accounting icon

Finance and Accounting

Cash flow management, P&L tracking, budget analysis. Businesses funding a quiet summer out of a term-time surplus and needing to know how much.

Healthcare and Insurance icon

Healthcare & Insurance

Patient record systems, policy tracking, compliance reports. Practices serving a population that changes substantially between terms.

Real Estate and Construction icon

Real Estate & Construction

Investment models, cost forecasting, expense tracking. Trades and landlords whose occupancy follows an academic rather than a calendar year.

If your industry relies on Excel for financial analysis, data tracking or reporting, we can optimize and automate your workflows to save time and improve performance.

How it runs

Working With an Excel Consultant in Arcata

Five stages. There is no fee for the first, and plenty of them close at that point with a recommendation instead of a quote.

  1. Say what the file has to answer

    The question it exists to settle and the point at which it stopped settling it. Sending the workbook makes this considerably more useful, though it is not required.

  2. Audit the file and the period

    Where the data comes from, who enters it, and what gets corrected every term. Those recurring corrections usually sit directly on the underlying fault.

  3. A written scope and price

    Both agreed before anything is built. The file has been read by then, so leaving either open would be a choice rather than a necessity.

  4. Build in the open

    Working versions as they emerge rather than one delivery at the end, because redirecting a build early costs almost nothing.

  5. Hand over in full

    The workbooks, any macro source, written documentation of how it operates, and training for the people who will run it next term.

Jeff Mattus, Owner and President of JAAD Group Excel Consulting

Who does the work

Jeff Mattus

Owner & President, JAAD Group

JAAD Group is Jeff Mattus, who founded the practice after more than twenty-five years of building Excel and Office systems, arriving at the work from Computer Science rather than from accounting. Where the task is to make a seasonal business legible, that is the background that helps.

Those projects have covered finance, healthcare, technology and property, which is why a first call usually produces a diagnosis rather than a discovery phase. A term-driven demand pattern has close structural relatives in industries with no university anywhere near them.

Delivery is remote, which is why distance from a major city makes no difference to what a business here can get. You deal with one person throughout: whoever takes the first call scopes the job and then builds it.

Organizations we have built for

Trusted With Business-Critical Spreadsheets

CAPTRUST
Trutina
Linmore LED
Gro-Well
McGregor Benefits
The Benefits Academy
Glen Acres HOA
Health Insurance Team
SSIS
OEC
SBA
Jesse Consulting

Why a specialist

Why Arcata Businesses Use a Dedicated Excel Consultant

A single discipline

Excel, VBA and Office automation are the entire practice, which is why a first-call diagnosis is usually accurate and the estimate close to the final number.

Reshape ahead of rebuild

Where the existing file can be restructured rather than replaced, that is the advice, and it is the cheaper route by a wide margin.

Built for a seasonal year

Reporting that compares term against term rather than month against month is the difference between a variance report and a calendar.

Documented at handover

Written explanation, source code and training are part of delivery, which matters most where staff turn over with the academic year.

Outcomes clients measured

Every result above was reported by the client using the tool, and all three projects appear in full earlier on this page.

Remote, so distance is irrelevant

Screen share rather than scheduling, which this far from a city is worth a great deal: nothing waits, and none of the fee is travel.

Questions

Frequently Asked Questions

What does Excel consulting in Arcata usually involve?

Most often it is changing the reporting period so comparisons are term against term rather than month against month, then modeling summer as its own business. After that it is landed cost and reorder work.

The records exist already in every case. What changes is the structure, which is what currently makes most comparisons meaningless.

Why are monthly comparisons a problem here?

Because the periods are not alike. Two term-time months are comparable to each other and not to a break; two calendar months either side of a term boundary have almost nothing in common.

Mapping each date to a period type and reporting against that produces a variance report about trading rather than about where the term happened to start.

How should we handle the summer?

As a separate period with its own revenue and cost assumptions rather than as a weak quarter. The revenue comes from somewhere else and most of the cost base does not change.

Modeled that way the real question becomes answerable: how much of the summer has to be funded from the preceding terms, and therefore what the business can commit to in September.

Should freight be tracked separately from unit price?

Yes, and for a business this far out it is one of the more valuable changes available. The two move independently and sometimes in opposite directions.

Separated out, the available saving frequently turns out to be in order size or consolidation rather than in the price of the goods, which is a conclusion you cannot reach while freight sits in overhead.

Our lead times are weeks. How should we decide what to order?

By projecting demand across the lead time rather than by holding a minimum stock level. A reorder point in that situation is a forecast whether or not anybody calls it one.

Built properly the projection also shows what being wrong costs in each direction, which is the figure that tells you how large the buffer should actually be.

Staff change every year. Does that affect how you build?

Considerably. A workbook that relies on somebody knowing which cell not to touch works only while that person is there, and here that can be a matter of terms.

Validation at entry, documentation and training on your own files rather than sample data are worth more in that environment than any dashboard, which is why they are included rather than sold separately.

How is this priced?

By scope, which is why the file is examined before any figure is named and why that look is free. A calendar table and a term-based report are small and fixed-price; a full rebuild is priced as one piece of work.

Either way, the deliverable and the price are both written down before anything gets built.

You are in Nevada. Does that work for a Humboldt County business?

It presents no obstacle, because remote working was the design from the outset. Going through a workbook together on a shared screen is identical whatever the distance, and this is a part of the state where that matters.

It also means no part of the invoice is travel, which to get here would not be a trivial line.

Whoever set our workbook up has gone. Can anything be done with it?

Usually. It gets read back to first principles, the fragile sections identified, and each repaired or replaced depending on what is honestly warranted.

Their absence is not the gap that matters. Time with whoever uses the output is, because agreeing what each figure is supposed to mean is the part that takes real thought.

What does a job like this run to?

A calendar table and term-based reporting is often a few days. Adding a summer model and a landed cost breakdown usually runs one to two weeks depending on the audit.

Big or small, the figure goes on paper before construction instead of surfacing midway.

What is ours when it is done?

The workbooks, any macro source code, written documentation of how each part works, and training for the people who will use it.

Afterward it runs on its own, and nothing recurring keeps it alive. More help is available on request and never part of the bargain.

Is that set of six a restriction?

No. They describe where most of the work has come from rather than what gets accepted, and the deciding factor is the nature of the problem rather than the sector.

A term-based sales report, a landed cost model, a reorder projection and a clinic rota are considerably more alike underneath than they look from outside.

Also serving

Excel Consulting Across California and Nevada

The work is delivered by screen share, so being on the north coast changes nothing about it. Other places with their own pages:

Straight to a service: Excel reporting for term-based comparison, financial modeling for the summer period, Excel consulting for landed cost, Excel automation for reorder projections, and VBA and macro development or Excel expert help for the rest.

Arcata is the hub here — schematic, not to scale

Send Us the Workbook

Describe what has gone wrong, or attach the file. You will be told flatly what has gone wrong and what clearing it would take, ahead of agreeing to anything at all.

949-464-7489

JAAD Group Excel Consulting · 2937 Hawksdale Dr, Las Vegas, NV 89134
Excel consulting services in Arcata, CA and across California, delivered remotely