
Excel consulting for Anderson and Shasta CountyCall 949-464-7489

Anderson, California · Shasta County

Excel Consulting Services in Anderson, CA

Up here a good deal of what leaves the yard sells at a price somebody else set. Lumber, crops and livestock are quoted by a market, not negotiated by the producer, which leaves exactly one side of the equation under local control: what it costs to produce a unit. JAAD Group provides Excel consulting in Anderson for the businesses that have to win on that side.

  • Cost per unit
  • Yield and waste tracking
  • Energy cost modeling
  • Equipment and maintenance cost
25+Years building Excel and Office systems for businesses
40+Person-hours a month returned on one reporting rebuild
1700Faster record retrieval after a workbook was restructured
66Improvement in budgeting accuracy across thirty entities

When the price is not yours to set

One Side of the Equation Is Fixed, So the Other Side Is Everything

A business that can price its own work has two levers. A business selling into a market quote has one. That single fact should shape its entire reporting, and in most of the workbooks we see here it has shaped none of it — the reports are organized around revenue, which is the half nobody local controls.

What matters instead is cost per unit, and cost per unit is not one number. It is a chain: input cost, yield from that input, conversion or processing loss, energy consumed, labor applied, and the share of equipment and maintenance that belongs to each unit produced. A business that knows its total cost and its total output knows an average; it does not know which link in that chain is costing it money.

The second local factor is heat. Summers in this part of the state are severe enough that energy stops behaving like a fixed monthly charge and starts behaving like a variable driven by temperature. A budget that carries one figure per month for power is therefore wrong in a predictable seasonal direction.

The third is equipment. In a price-taking business the age and condition of plant feeds directly into cost per unit through downtime, waste and consumption, which means maintenance is a margin question rather than a housekeeping one.

Knowing total cost and total output gives you an average. It does not tell you which link in the chain is the one losing money.

What the work is really about

What Excel Consulting in Anderson Usually Involves

Cost per unit is a chain, not a figure

The first piece of work is nearly always to break cost per unit into its components, because an average conceals exactly what needs to be seen. Input cost, yield, processing loss, energy, labor and an equipment share each belong as their own line, measured per unit of output rather than per month. Once they are separated, the comparison that matters becomes available: which component has moved, by how much, and over what period. In a price-taking business that is the only analysis that can change anything, because nothing on the revenue side is available to work with. Producing it is a restructuring of records that already exist rather than a new measurement program, and it is the core of the Excel consulting work here.

Yield and waste are margin rather than housekeeping

Second, yield and waste deserve promotion from an operational detail to a reported number. A percentage point of yield across a season is a material sum, and it very rarely appears anywhere a manager would see it, because the records that would produce it sit in production logs rather than in the accounts. Bringing them together — input quantity, output quantity, loss, by batch or by run — gives a yield figure that can be trended, and trended yield is how a slowly degrading process gets caught. Without it, the deterioration is absorbed into cost and only noticed when somebody asks why margin has drifted over two years.

Energy here moves with the thermometer

Third, energy needs modeling as a variable rather than budgeted as a line. Where summer temperatures are what they are here, consumption for cooling, refrigeration and the additional load on motors and compressors rises in a way that tracks the weather. A model that separates consumption from unit rate, and ties consumption to temperature as well as to output, produces an energy forecast that is defensible and an energy variance that can be explained. It also makes the case for any efficiency investment calculable rather than rhetorical, which is a straightforward piece of financial modeling.

Equipment age feeds straight into unit cost

Fourth, equipment has to be connected to unit cost rather than kept in a separate maintenance record. Downtime reduces output over the same fixed cost base, aging plant consumes more energy per unit and produces more waste, and deferred maintenance shows up as all three at once. Where the records allow it, holding run hours, downtime events and maintenance spend against each major asset and relating them to the output produced in the same period turns a replace-or-repair argument into an arithmetic question. That is usually the decision with the largest single effect on cost per unit available to a business of this kind.

A rural catchment caps the volume

Fifth, the catchment limits volume, and that changes which efficiencies are worth pursuing. Serving a rural market means demand has a practical ceiling that no amount of selling will lift, so an improvement that only pays back at higher volume is not available here regardless of how good it looks in a vendor's model. Running those calculations against your own realistic volume rather than against a generic one is a small discipline that prevents a particular and expensive category of mistake. The same applies to automation itself: the honest answer is sometimes that a process is not run often enough to be worth automating, and you should expect to hear that.

The gap is structure, not a software purchase

None of this requires buying anything. The production logs, the utility invoices, the maintenance records and the sales data all exist; they are held separately, which is precisely why the chain cannot be seen. Restructuring is days of work rather than a procurement cycle, and an hour of Excel expert help will usually establish how much of it applies.

What gets built

Excel Consulting Services in Anderson, CA — The Six Areas

Six kinds of work. For a price-taking business the first two account for most of what gets commissioned.

Excel consultant breaking cost per unit into its component lines Structure

Cost Per Unit, Broken Into Its Links

Input cost, yield, processing loss, energy, labor and an equipment share, each measured per unit of output. An average conceals the one component that has actually moved.

  • Each component per unit rather than per month
  • Movement by component so the cause is identifiable
  • Formula repair for references that stopped pointing anywhere
  • Performance — volatile formulas replaced with tables and pivots

Related: Excel consulting
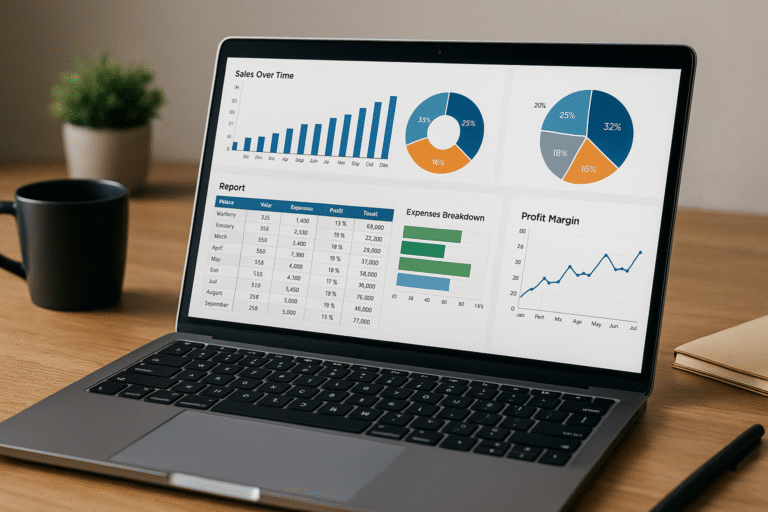
Excel report trending yield and waste by production run Reporting

Yield and Waste as Reported Numbers

Input quantity, output quantity and loss by batch or run, trended. A slowly degrading process is caught by a trend and invisible in a monthly cost total.

  • Yield by batch or run, trended over time
  • Waste reported rather than absorbed into cost
  • Live connections to production logs and sales records
  • Exception flags when a run falls out of pattern

Related: Excel reporting
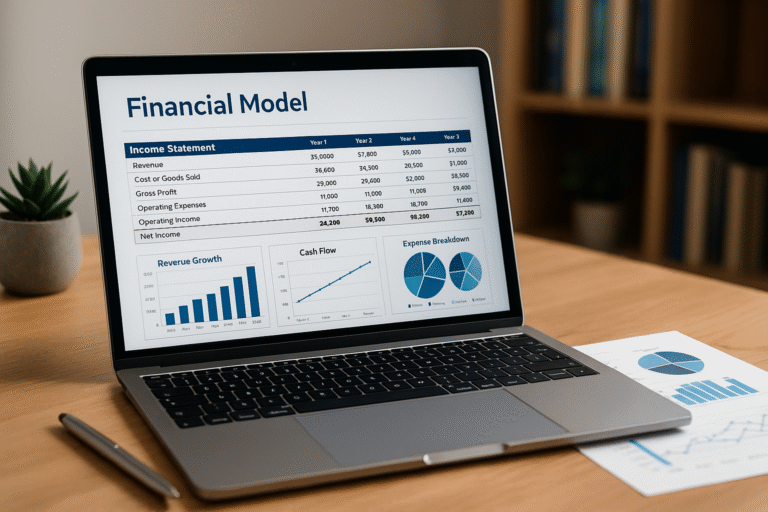
Excel model tying energy consumption to temperature and output Modeling

Energy as a Variable, Not a Monthly Line

Consumption separated from unit rate, and tied to temperature as well as to output. It makes the energy variance explainable and any efficiency case calculable.

  • Consumption and rate separated as distinct inputs
  • Temperature as a driver alongside production volume
  • Payback tested against your own volume, not a generic one
  • Assumptions in one visible block, never inside formulas

Related: Excel financial modeling

Automated consolidation of production logs and utility invoices in Excel Automation

Bringing the Separate Records Together

Production logs, utility invoices, maintenance spend and sales all arrive from different places. Consolidated automatically, the cost chain is current rather than rebuilt each period.

  • Scheduled consolidation across logs, invoices and sales
  • Refresh from source rather than from a saved download
  • Import cleanup for files that never match the previous format
  • Running totals so a drift in a component shows up early

Related: Excel automation

VBA form capturing run hours downtime and maintenance against each asset Code

VBA for Asset and Run Records

Run hours, downtime events and maintenance spend held against each major asset, captured consistently. That is what turns a repair-or-replace argument into arithmetic.

  • Entry forms capturing run hours and downtime reliably
  • Asset-level records rather than one maintenance total
  • Repeatable routines for anything done every run
  • Legacy macro repair where the author has moved on

Related: VBA and macro development

Remote Excel expert help session with a Shasta County producer Support

Expert Help and Team Training

Often there is no project, only a figure that has to be right before a purchase is committed. One conversation, your workbook shared across, and a written note of why it behaved as it did.

  • Same-week attention when a decision will not wait
  • Training on your own workbooks rather than sample files
  • Written handover so the tool survives a staff change
  • Retained hours where there is no in-house Excel depth

Related: Excel expert help and MS Office training

Where it starts

Eight Conversations That Begin an Anderson Excel Project

Openings we hear from price-taking businesses, and what the answer usually turns out to be.

"Margin has drifted for two years and nobody can say why."

Because the reporting gives an average cost rather than a chain. Separated into components per unit, the one that moved is usually obvious inside a period of data.

"Nobody reports yield."

Which is where a percentage point across a season disappears. The records exist in production logs; they simply never reach anywhere a manager would look.

"The power bill is a shock every summer."

It is forecastable, but not from a model carrying one figure per month. Tying consumption to temperature as well as to output makes it predictable and explainable.

"We cannot decide whether to repair or replace."

Because downtime, consumption and waste are not connected to the asset causing them. Held against each machine and related to output, it becomes an arithmetic question.

"A vendor's payback calculation looked great."

On their volume assumption, probably. Run against the volume your catchment actually supports, a fair number of those cases stop working.

"Our production log and our accounts never meet."

Which is exactly why the cost chain is invisible. Consolidating them is the enabling step for everything else and is usually a few days of work.

"If she is away, there are no figures."

That is an architecture problem wearing the costume of a staffing one. Writing it down and automating the mechanical parts keeps the reporting alive through holidays and departures.

"The workbook has got slow and fragile."

Usually volatile functions across large ranges, or an array formula doing a pivot table's job. Reconstructed sensibly the speed returns and not one feature anybody depends upon goes missing.

A quick check

Signs a Price-Taking Business Has Outgrown Its Spreadsheet

Nobody plans this work. It follows a season where margin was thinner than anybody expected, or a machine purchase that never paid back. The earlier signals look like this:

  • Cost per unit is one number rather than a chain of components
  • Yield is never reported anywhere a manager would see it
  • Energy is budgeted as a flat monthly figure
  • Downtime is not connected to the asset that caused it
  • Payback cases use a vendor's volume rather than yours
  • Production logs and accounts are never brought together
  • Waste is absorbed into cost and never trended
  • One person is the whole process, and everybody knows it

What the missing detail costs

Yield is the quiet one. A degradation of a point or two is invisible in a monthly cost figure and material across a season, and because it accumulates slowly it gets attributed to market conditions rather than to a process that needs attention.

The equipment decision is the loud one. Repair-or-replace made without connecting downtime, consumption and waste to the asset involved is a judgment call on a question that could have been arithmetic, and the wrong answer stays on the books for years.

What happens before a quote

The workbook gets read alongside the operating cycle — what gets logged, who logs it, and which figures exist only because somebody remembers them. Here the production log is usually accurate and simply never meets the financial records.

Frequently the finding is that consolidating the logs with the accounts answers the whole question, and that is the recommendation. Where a process is not run often enough to justify automating, you will be told that too. That opening discussion is unpaid whichever way it goes.

Work delivered

Three Projects and the Figures Recorded

Real builds for real organizations. Each number came from the client once the tool had been in regular use.

Excel budgeting template with access levels across thirty companies

66% better
accuracy

One budgeting tool for thirty companies

Where it started
A management company overseeing thirty separate businesses budgeted each independently and consolidated by hand, with several people needing different levels of access to one workbook.
What got built
A budgeting template with access tiers, VBA rolling approved budgets into a master sheet, adjustable payroll, tax and benefits inputs, and a direct load into the accounting system.
What it changed
Hand entry left the process completely. Budgeting accuracy rose 66%, the build cycle ran over ten times faster, and reforecasting during the year became a realistic option.

Automated report assembled from more than fifty sources

40 hours
a month back

Operations reporting taken off manual

Where it started
Reports were maintained by hand for internal management and for outside funding institutions, and a single update cycle could take three days.
What got built
A program pulling more than fifty sources into one document in about five minutes, with each source inspectable beforehand and draft versions produced for comparison.
What it changed
An eight-hour task now finishes in minutes, handing back at least forty person-hours every month from work that created nothing new.

Workbook rebuilt onto native Excel tables with pivot tables and slicers

Nine minutes
to thirty seconds

A workbook that had stopped working

Where it started
Retrieving one record from a 1,200-row workbook could take as long as nine minutes, the result of layered array formulas and years of code added without review.
What got built
Data moved onto native Excel tables, pivot tables with slicers replacing the search logic, and the redundant VBA and array formulas removed rather than worked around.
What it changed
Thirty seconds for the same retrieval on the same hardware. The file had never needed a faster machine, only a better structure.

Who this applies to

Industries We Serve in Anderson

The six areas JAAD Group covers, described as they appear in northern Shasta County.

Manufacturing and Logistics icon

Manufacturing & Logistics

Supply chain analysis, production scheduling, vendor performance. Processing operations where yield, waste and energy per unit decide the margin.

Finance and Accounting icon

Finance and Accounting

Cash flow management, P&L tracking, budget analysis. Businesses selling at a market price, where cost per unit is the only controllable side.

Retail and E-commerce icon

Retail and E-commerce

Inventory monitoring, sales tracking, profit calculations. Trade serving a rural catchment with a practical ceiling on volume.

Real Estate and Construction icon

Real Estate & Construction

Investment models, cost forecasting, expense tracking. Contractors and landowners working across a wide and thinly populated area.

Healthcare and Insurance icon

Healthcare & Insurance

Patient record systems, policy tracking, compliance reports. Practices and agencies serving the northern end of the Sacramento Valley.

Education and Training icon

Education & Training

Enrollment reports, course progress dashboards, grant tracking. Training providers reporting to funders whose periods never match the internal ones.

If your industry relies on Excel for financial analysis, data tracking or reporting, we can optimize and automate your workflows to save time and improve performance.

How it runs

Working With an Excel Consultant in Anderson

Five stages. Stage one is unpaid, and a respectable share of them finish at that point with guidance rather than a quotation.

  1. Say which decision depends on it

    The choice the figures exist to support, and where they stopped supporting it. Sending the workbook makes the conversation considerably more useful, though it is not required.

  2. Audit the logs and the accounts

    What gets recorded on the floor, what reaches the accounts, and what gets corrected every period. The gap between those two is usually where the answer is.

  3. Scope and price, written first

    Settled ahead of construction. The records will already have been read, which is why vagueness about scope or cost would be a decision rather than an unavoidable fact.

  4. Build in the open

    Working versions as they are produced instead of one handover at the end, because redirecting early costs almost nothing.

  5. Hand over fully

    The workbooks, any macro source, a written account of how it operates, and training for whoever runs it from here.

Jeff Mattus, Owner and President of JAAD Group Excel Consulting

Who does the work

Jeff Mattus

Owner & President, JAAD Group

JAAD Group is Jeff Mattus, who founded the practice after more than twenty-five years of building Excel and Office systems, having come to the work from Computer Science rather than from accounting. Where the task is to connect a production log to a cost figure, that is the background that makes it tractable.

The projects have run through finance, healthcare, technology and property. That spread is why a first conversation usually ends in a diagnosis rather than a discovery phase: a cost-per-unit chain has close structural relatives in industries with nothing agricultural or industrial about them.

Delivery is remote, which is how a Shasta County business works with a practice based in Nevada without that mattering at all. You deal with one person: whoever takes the first call scopes the job and then carries it out.

Organizations we have built for

Trusted With Business-Critical Spreadsheets

CAPTRUST
Trutina
Linmore LED
Gro-Well
McGregor Benefits
The Benefits Academy
Glen Acres HOA
Health Insurance Team
SSIS
OEC
SBA
Jesse Consulting

Why a specialist

Why Anderson Businesses Use a Dedicated Excel Consultant

A single discipline

Excel, VBA and Office automation are the whole practice, which is why a first-call diagnosis is usually accurate and the estimate close to the final number.

Reshape ahead of rebuild

Where the existing records can be restructured instead of replaced, that is the advice, and it is far the cheaper route.

Built for a price-taker

Reporting organized around cost per unit rather than around revenue, because revenue is the half you do not control.

Honest about payback

If a process is not run often enough to be worth automating, that is what you will be told rather than quoted for.

Documented at handover

Written explanation, source code and training come with delivery, so the tool outlasts a change of staff.

Distance simply does not register

Everything happens over a shared screen. No work is held up waiting for a journey, and no portion of the bill is mileage.

Questions

Frequently Asked Questions

What does Excel consulting in Anderson usually involve?

Most often it is breaking cost per unit into its components — input, yield, loss, energy, labor, equipment share — so the one that has moved can be identified. After that it is yield reporting and energy modeling.

The records exist already, generally in production logs that never meet the accounts. What changes is bringing them together and organizing them per unit of output.

Our margin has drifted and we cannot find the cause. Why not?

Because an average cost per unit conceals the chain behind it. If the reporting gives one figure, every component is hidden inside it and none of them can be compared over time.

Separated out, the component that moved is usually identifiable within a single period of data, and that is the only analysis available when the selling price is set elsewhere.

Why does yield matter so much?

Because a point or two across a season is a material amount of money, and it is invisible in a monthly cost total. Yield degradation is slow, so it gets attributed to the market rather than to a process.

Input quantity, output quantity and loss recorded by run and then trended is what catches it. The data is usually already being written down on the floor.

Can the summer power bill be forecast?

Yes, but not from a budget carrying one figure a month. Consumption here rises with temperature through cooling, refrigeration and additional load on motors, independently of how much you produce.

Separating consumption from the unit rate and tying consumption to both temperature and output gives a forecast that holds and a variance that can be explained.

How do we decide whether to repair or replace a machine?

By connecting downtime, energy consumption and waste to the specific asset and relating them to the output produced in the same period. Most records keep maintenance separately from all three.

Done that way the question becomes arithmetic rather than judgment, and it is often the single decision with the biggest effect on cost per unit.

A supplier showed us a payback calculation. Should we trust it?

Check the volume assumption behind it. Serving a rural catchment means demand has a ceiling, and an improvement that only pays back at higher throughput is not available to you however good the case looks.

Running the same calculation against your own realistic volume takes very little time and prevents a particular and expensive category of mistake.

How is this priced?

Scope decides it, and that is the reason the records get read before a number is put forward, at no charge. Consolidating logs with accounts is small and fixed-price; a full cost-chain rebuild is priced as one piece of work.

In both situations the purchase and its price are recorded before a single formula is constructed.

You are in Nevada. Does that work for a business up here?

It causes no difficulty, since remote delivery was the intention from the start. Going through a workbook together on a shared screen is identical at any distance, and nothing waits for somebody to make a long drive.

It also means no part of the invoice is travel, which to reach this part of the state would not be a small line.

The person who built our spreadsheet has gone. Can it be used?

Usually yes. We rebuild our understanding of it from the bottom, flag the parts barely holding, and then mend or rewrite each one according to what it truly merits.

Recovering whoever wrote it is not the requirement. Time with whoever depends on the output is, because agreeing what each figure is meant to represent is the part that takes real thought.

How long is this likely to run?

Consolidating production logs with the accounts is often a few days. A full cost-per-unit chain with yield trending and an energy model usually runs one to two weeks depending on what the records look like.

Large job or small, that figure is written down ahead of construction rather than revealing itself as the work unfolds.

What remains ours afterward?

You take the files themselves, the code sitting behind them, a written description of every moving part, and time with whoever will operate it.

Once delivered it stands alone, with no recurring payment attached. Additional assistance is there for the asking and forms no part of the agreement.

Do those six sectors mark a boundary?

No. The list reflects where enquiries have tended to originate rather than any rule about what is taken on. The thing that settles it is the shape of the problem itself.

A cost-per-unit chain, a yield trend, an energy model and a clinic rota are considerably more alike underneath than they look from outside.

Also serving

Excel Consulting Across California and Nevada

The work is delivered by screen share, so being this far north changes nothing about it. Other places with their own pages:

By service: Excel consulting for the cost-per-unit chain, Excel reporting for yield and waste, financial modeling for energy and payback, Excel automation for consolidating the records, and VBA and macro development or Excel expert help for the rest.

Anderson is the hub here — schematic, not to scale

Send Us the Workbook

Describe what has gone wrong, or attach the file. You are given a flat description of the defect and of the effort involved in clearing it, and nothing is agreed at that stage.

949-464-7489

JAAD Group Excel Consulting · 2937 Hawksdale Dr, Las Vegas, NV 89134
Excel consulting services in Anderson, CA and across California, delivered remotely