
Enterprise, Nevada · Southwest Las Vegas Valley
Excel Consulting Services in Enterprise, NV
Enterprise has added more people in the last decade than most Nevada towns contain. For a business here that creates an unusual reporting problem: your own history describes a smaller market than the one you are now trading in, so last year is not a baseline, it is an understatement. JAAD Group provides Excel consulting in Enterprise for businesses forecasting against a target that keeps moving.
- Forecasting a growing catchment
- Share and per-capita models
- Capacity timing
- Automation and VBA
The market moved while you were measuring
When Last Year Describes a Smaller Place Than the One You Trade In
Almost all business reporting assumes the market is roughly the same size as it was and asks how the business performed within it. In a community adding households every quarter that assumption fails quietly, and in a specific direction: growth gets read as success when some of it is simply arrival, and flat trading is actually a loss of position.
The first consequence is misread performance. A business whose revenue rose ten percent in a catchment that grew fifteen has gone backward in the only sense that matters, and nothing in a conventional report will say so. The opposite error is just as common: a genuinely improving business congratulates itself for market growth it did nothing to earn.
The second is that every figure expressed per head or per household is out of date immediately. Those measures are useful, but only if the denominator is being refreshed rather than typed in once. Most workbooks here carry a population figure that was correct at some point and has not been revisited since.
The third is timing. Capacity decisions — staff, space, stock, a second site — have to be made against where the catchment will be when the capacity arrives, not where it was when the decision was taken.
What the work is really about
What Excel Consulting in Enterprise Usually Involves
Growth and arrival are two different things
The first and most valuable change is to separate growth you earned from growth that arrived. That means expressing the business's own numbers against a measure of the catchment rather than against last year alone: revenue per household, transactions per thousand residents, or whatever unit fits the trade. The figure does not have to be precise to be useful, because what carries the information is the direction of travel rather than the absolute level. Once it exists, a year of rising revenue can be read correctly, and the uncomfortable cases — up in absolute terms, down per head — become visible while there is still time to respond. That is the central piece of Excel consulting work here.
A per-household figure needs a live denominator
Second, the denominator has to be live rather than remembered. A population or household figure entered once during a planning exercise and carried forward is worse than no figure at all, because it produces confident per-head numbers that drift further from reality every quarter. Holding the catchment measure as a dated input, refreshed on a schedule from whatever source the business trusts, keeps those measures honest. It is a small amount of structure and it is the difference between a useful ratio and a misleading one. Keeping it current rather than rebuilding it annually is straightforward Excel automation.
Flat trading in a growing market is a loss
Third, the implication for a flat year deserves stating plainly because it is counter-intuitive. In a static market, flat trading is a holding position. In a market adding households steadily, flat trading means a shrinking share, and share lost during a growth phase is considerably harder to win back later, once the newcomers have formed habits. A business that can see that happening has options; a business reading only its own revenue line will not notice until the absolute figures finally turn, which is well after the cause.
Capacity has to be timed to where the market will be
Fourth, capacity timing is the decision most often got wrong here, and it is a modeling problem rather than a judgment call. Staff, space, stock and a second location all take time to arrive, and the right question is what the catchment will support when they do rather than what it supports today. Built as a model with the growth rate as an explicit input, the comparison becomes concrete: here is the capacity, here is when it lands, here is the demand it will meet. That also exposes the cost of being early, which is real and is usually the thing nobody has priced. It is a short piece of financial modeling with a large decision attached.
New competitors appear faster than reporting notices
Fifth, competition arrives on the same curve as the households, and most reporting notices it late. A new entrant in a growing catchment can take all of the increment without the incumbent's revenue falling at all, which means the first sign is not a decline but a stalling of growth that looks like normal variation. Watching the per-household measure rather than the revenue line is what catches it, which is the same structural point as everything above applied to a competitive question rather than a performance one.
The fix is structural rather than a purchase
None of this requires buying anything. The transaction records exist, the catchment data is publicly available, and the growth rate is not a secret. What is missing is a structure that holds the denominator as a live input and reports the business against it. Restructuring is days of work, and an hour of Excel expert help will usually establish how much of it you need.
What gets built
Excel Consulting Services in Enterprise, NV — The Six Areas
Six kinds of work. For a business in a fast-growing catchment, the first two account for most of what gets commissioned.

Structure
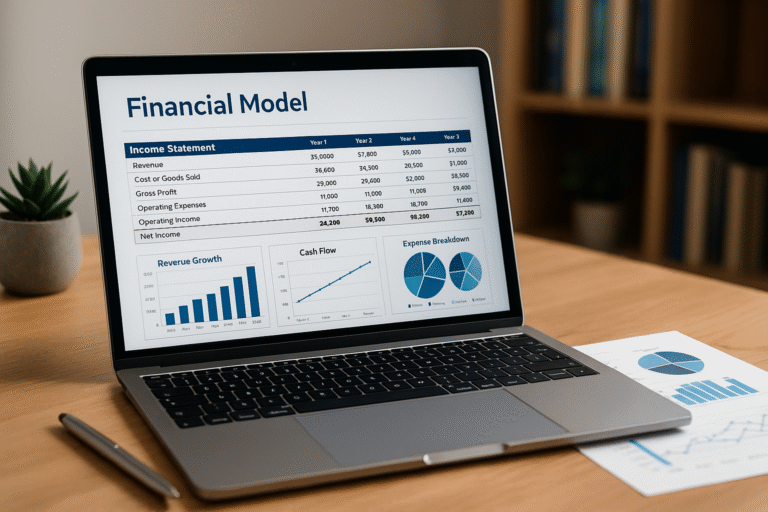
Separating Earned Growth From Arrival
Revenue per household, transactions per thousand residents, or whatever unit fits. The direction of travel is what carries the information, not the absolute level.
- Performance per head alongside the absolute figures
- Earned growth distinguished from market growth
- Formula repair for references that stopped pointing anywhere
- Performance — volatile formulas replaced with tables and pivots
Related: Excel consulting
Modeling
Timing Capacity to a Moving Target
Staff, space, stock and a second site all take time to arrive. The model compares the capacity, when it lands, and the demand it will actually meet.
- Growth rate as an explicit input, dated
- Capacity lead times built into the comparison
- Cost of being early made visible rather than assumed away
- Assumptions in one visible block, never inside formulas
Related: Excel financial modeling
Automation
A Denominator That Refreshes Itself
A population figure typed in once and carried forward is worse than none, because it produces confident per-head numbers that drift every quarter.
- Catchment measure as a dated input, refreshed on schedule
- Transaction imports brought in alongside it
- Import cleanup for sources that shift format between runs
- Drift alerts when a per-head measure turns
Related: Excel automation
Reporting
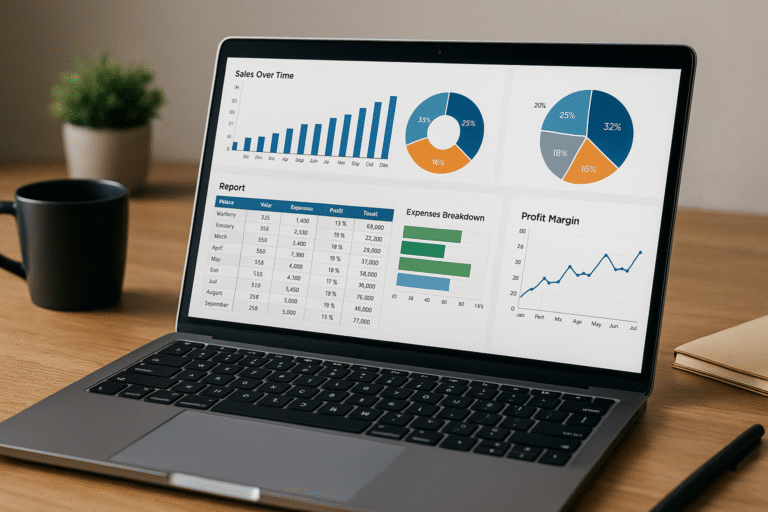
Two Lines on One Chart
Your growth and the catchment's growth, together. A new competitor can take the whole increment without your revenue falling, and that shows up here before anywhere else.
- Revenue and catchment plotted on the same axis
- Stalling growth flagged rather than read as variation
- Live connections to the systems already holding the data
- Exception flags when share moves rather than volume
Related: Excel reporting

Code
VBA to Recalculate the Whole History
When the denominator is refreshed, every historical period needs recomputing against the figure that applied at the time. By hand that gets skipped; as a routine it is instant.
- Historical recalculation against the correct period figure
- Deterministic routines for anything run every period
- Validated entry so a figure cannot be saved without its date
- Legacy macro repair where whoever wrote it has gone
Related: VBA and macro development

Support
Expert Help and Team Training
Sometimes there is no project, only a figure that has to support a decision about space or staff this month. One call, your own file shared across, and the reasoning written down.
- Same-week attention when a decision will not wait
- Training on your own file rather than on sample data
- Written handover so the tool outlives a manager
- Retained hours where there is no in-house Excel depth
Related: Excel expert help and MS Office training
Where it starts
Eight Conversations That Begin an Enterprise Excel Project
Openings we hear from businesses in a growing catchment, and what the answer usually turns out to be.
"Revenue is up and it does not feel like we are winning."
Often because the catchment grew faster than the revenue did. Expressed per household, that year may well have been a decline, and the figure says so plainly.
"Our population assumption is years old."
Which makes every per-head figure built on it confidently wrong. Held as a dated input and refreshed on a schedule, those measures become usable again.
"Growth has flattened and nothing has obviously changed."
In a growing market a new entrant can take the whole increment without your revenue falling. Stalling growth is the first sign, and it looks like ordinary variation.
"We do not know when to take more space."
A timing question, and a modeling one. Capacity lead times against projected catchment turn it into a comparison rather than a judgment.
"We expanded early and it hurt."
The cost of being early is real and almost never priced. Built into the model it becomes one of the options rather than an unpleasant discovery.
"Last year is our baseline for everything."
Which systematically understates the market you are now in. The baseline has to move with the catchment or it is not a baseline.
"Only one person can produce the figures."
A structural dependency rather than a staffing gap. Documentation and automation keep the reporting running through absence and turnover.
"The workbook has got slow and awkward."
Usually volatile functions across large ranges, or an array formula doing a pivot table's job. Rebuilt properly it moves quickly again and nothing is lost.
A quick check
Signs the Reporting Has Not Kept Up With the Market
Nobody plans this work. It follows a year that looked good and felt wrong, or a space decision that turned out to be a season early. Earlier signals look like this:
- Nothing is reported per household or per head of catchment
- The population figure carries no date and has not been revisited
- Last year is the baseline for a market that is not last year's size
- Growth and catchment are never plotted together
- Capacity decisions are judged against today rather than delivery date
- The cost of expanding early has never been calculated
- Stalling growth gets read as normal variation
- One person produces everything, and everybody knows it
What the missing denominator costs
The misread year is the expensive one. A business that takes a per-head decline as a good year will keep doing whatever produced it, and share lost while a catchment is filling up is much harder to recover once newcomers have settled into habits elsewhere.
The timing error cuts both ways and both are costly. Capacity taken a year early carries cost against demand that has not arrived; capacity taken a year late hands the increment to somebody else during the period when habits are being formed.
What happens before a quote
We look at the file alongside the decisions in front of it — what is being planned, on what basis, and which figures those plans rest on. The catchment number is almost always present somewhere and almost always undated.
Frequently the finding is that a per-household measure with a live denominator answers the whole question, and that is what gets recommended. Where part of this genuinely needs more than a spreadsheet, you will be told so. The opening conversation is unpaid either way.
Work delivered
Three Completed Builds and What Changed
Genuine projects for real organizations. The numbers came back from the businesses themselves once the tools had bedded in.

66% better
accuracy
A budget tool shared across thirty companies
- The position
- A management company carried thirty separate businesses, each budgeting alone and consolidated afterward by hand, with several people needing different levels of access to one workbook.
- The build
- A template with tiered permissions, VBA moving each approved budget into a master sheet, payroll, tax and benefits adjustable from the front, and totals loading straight into the accounting system.
- The result
- Double entry disappeared from the process. Accuracy rose 66%, the build cycle ran more than ten times faster, and reforecasting part-way through the year became practical.

40 hours
a month back
Manual reporting automated
- The position
- Reports for internal management and for external funding institutions were built entirely by hand, with a single refresh cycle running as long as three days.
- The build
- A program drawing more than fifty sources into one document in roughly five minutes, with each source checkable beforehand and drafts produced for comparison.
- The result
- A task that had taken a full working day now finishes in minutes, returning at least forty person-hours each month from work that produced nothing new.

9 minutes
to 30 seconds
A workbook that had stopped being usable
- The position
- Retrieving one record from twelve hundred rows could take nine minutes, the product of array formulas layered on each other and years of code added without review.
- The build
- The data moved onto native Excel tables, pivots and slicers replacing the lookup logic, and the redundant array formulas and VBA taken out rather than worked around.
- The result
- Thirty seconds for the same record on the same hardware. Structure had been the constraint all along, never processing power.
Who this applies to
Industries We Serve in Enterprise
The six areas JAAD Group covers, described as they appear in a community still being built.

Retail and E-commerce
Inventory monitoring, sales tracking, profit calculations. Trade in a catchment that is larger every quarter than the history describes.

Real Estate & Construction
Investment models, cost forecasting, expense tracking. Builders and contractors working in front of the households that will follow.

Healthcare & Insurance
Patient record systems, policy tracking, compliance reports. Practices sizing capacity against a population that keeps arriving.

Finance and Accounting
Cash flow management, P&L tracking, budget analysis. Businesses whose baseline has to move with the market rather than with the calendar.

Manufacturing & Logistics
Supply chain analysis, production scheduling, vendor performance. Suppliers serving a rapidly expanding residential base.

Education & Training
Enrollment reports, course progress dashboards, grant tracking. Providers planning intakes against a growing catchment.
If your industry relies on Excel for financial analysis, data tracking or reporting, we can optimize and automate your workflows to save time and improve performance.

How it runs
Working With an Excel Consultant in Enterprise
Five stages. Nothing is charged for the first, and a decent share of jobs stop there with a recommendation rather than a quote.
Say what decision is in front of you
The plan the figures are supposed to support. Sending the workbook makes the call considerably sharper, though it is not a requirement.
We look at the file and the plan
What is being decided, on what basis, and which figures those plans rest on. The catchment number is usually present and usually undated.
Scope and figure agreed first
Both on paper before construction. The file has been read by then, so leaving either vague would be a decision rather than a necessity.
Built where you can see it
Each working version reaches you as it is finished rather than everything together, which is what makes an early change inexpensive.
Handed over in full
The workbooks, any code behind them, a written account of how the catchment measure is maintained, and time with whoever will run it.
Who does the work
Jeff Mattus
Owner & President, JAAD Group
JAAD Group is one person, Jeff Mattus, who put the practice together over more than twenty-five years of Excel and Office systems work and who arrived at the field through Computer Science rather than through accounting. Where a figure needs a denominator that keeps moving, the useful instinct is to treat it as data rather than as a constant.
Those engagements have reached into finance, healthcare, technology and property. The spread is why an opening call generally produces a diagnosis rather than a discovery phase: a share-of-a-growing-market problem has close relatives in capacity planning across industries with no residential growth near them.
For a business here the practical point is that nobody sits in between. The person who answers prices the work and then carries it out, so no part of the conversation needs repeating.
Organizations we have built for
Trusted With Business-Critical Spreadsheets














Why a specialist
Why Enterprise Businesses Use a Dedicated Excel Consultant
A single discipline
Excel, VBA and Office automation are the whole practice, which is why an opening diagnosis is usually right and the estimate close to the final figure.
Reshape before replacing
If the existing records can be restructured rather than thrown away, that is the advice, and it costs considerably less.
Built for a moving market
A baseline that does not move with the catchment is not a baseline, and no amount of presentation fixes that.
Handed over documented
Written explanation, any code and training come with delivery, so the tool outlives the manager who commissioned it.
Numbers the clients reported
Each outcome quoted above came from the business running the tool, and all three builds appear at length earlier.
Remote, so it starts quickly
Everything happens over a shared screen, so a decision that will not wait gets attention the same day and none of the fee is travel.
Questions
Frequently Asked Questions
What does Excel consulting in Enterprise usually involve?
Most often it is expressing the business's own numbers against the size of its catchment, so growth that was earned can be told apart from growth that simply arrived.
After that it is keeping that denominator live rather than typed in once, and timing capacity decisions against where the market will be when the capacity lands.
Why is per-household reporting worth the effort?
Because in a catchment that keeps growing, absolute revenue cannot tell you whether you are winning. Up ten percent in a market that grew fifteen is a decline.
The measure does not need to be precise to be useful. What carries the information is the direction it moves in, and that is enough to change a decision.
Our population figure is old. Does that matter much?
More than having no figure at all, because it produces confident per-head numbers that get further from reality every quarter.
Held as a dated input and refreshed on a schedule from a source you trust, the same measures become reliable. It is a small amount of structure for a large improvement.
Growth has flattened and nothing obvious changed. What should we look at?
The per-household line rather than the revenue line. In a growing market a new competitor can take the entire increment without your revenue falling at all.
That makes stalling growth the first symptom rather than a decline, and stalling growth looks exactly like ordinary variation until you have something to compare it against.
How do we decide when to take more space or more staff?
By modeling the lead time against projected catchment, so the comparison is between the capacity, the date it lands and the demand it will then meet.
That also prices the cost of being early, which is real and is normally the factor nobody has quantified before committing.
Should historical figures be recalculated when the denominator changes?
Yes, against the figure that applied in each period rather than the current one. Done by hand that step gets skipped, which quietly corrupts the trend.
As a routine it takes seconds and keeps the history comparable, which is the whole point of having the measure.
What will this cost?
Scope decides it, which is why the file is read before a figure is named and why that reading is free. A per-household measure is small and fixed-price; a capacity model is priced as one job.
In both cases the deliverable and the price are recorded before construction begins.
Do you come out to the business?
No. Everything happens over a shared screen, which works the same at any distance and means a decision that will not wait is looked at the day it arises.
It also keeps travel off the invoice, which on a smaller engagement is a real share of the total.
The person who built our reporting has left. Can it be used?
Usually. The file is taken apart down to its logic, whatever is only just holding gets marked, and each part mended or rebuilt according to what it needs.
Having them back would not be the help. Time with whoever reads the output is, because settling what each figure is meant to say is the demanding part.
How long is this likely to take?
A per-household measure with a live denominator is often a few days. Adding a capacity timing model and historical recalculation usually runs one to two weeks.
However large the job, the figure goes on paper ahead of construction rather than surfacing partway through.
What do we keep at the end?
The workbooks, any code behind them, a written account of how the catchment measure is maintained, and time with whoever will operate it.
Nothing depends on us afterward and no recurring charge keeps it alive. Further help exists on request and is never a condition.
Are those six sectors a restriction?
No. They describe where enquiries have tended to come from rather than what gets accepted, and the deciding factor is the shape of the problem.
A per-household measure, a capacity timing model, a share comparison and a clinic rota are far more alike underneath than they look from outside.
Also serving
Excel Consulting Across the Las Vegas Valley and Nevada
The work is delivered over a shared screen, so which part of the valley you are in makes no difference. Other places with their own pages:
Straight to a service: Excel consulting for the per-household measure, financial modeling for capacity timing, Excel automation for the live denominator, Excel reporting for the two-line view, and VBA and macro development or Excel expert help for the rest.
Enterprise is the hub here — schematic, not to scale
Send Us the Workbook
Tell us what decision the figures are supposed to support, or attach the file. You get a flat read on the problem and what fixing it would take, with nothing agreed at that point.
949-464-7489JAAD Group Excel Consulting · 2937 Hawksdale Dr, Las Vegas, NV 89134
Excel consulting services in Enterprise, NV and across the valley, delivered remotely