
Excel consulting for Buena Vista businessesCall 949-464-7489

Buena Vista, Virginia · Independent city

Excel Consulting Services in Buena Vista, VA

For an energy-intensive operation the bill is not mostly about how much you used. It is about when you used it, how hard you peaked, and which tariff you happen to be on — and almost nobody has taken their own tariff apart far enough to see where the money is actually being made. JAAD Group provides Excel consulting in Buena Vista for businesses whose largest controllable cost is energy.

  • Tariff analysis
  • Demand charges and peaks
  • Load profile
  • Automation and VBA
25+Years building Excel and Office systems for businesses
40+Person-hours a month returned on one reporting rebuild
1700Faster record retrieval after a workbook was restructured
66Improvement in budgeting accuracy across thirty entities

When, not just how much

A Single Half Hour Can Set the Charge for a Year

Energy bills behave unlike almost any other cost. Part of the charge follows consumption in the ordinary way, and part follows the highest demand you reached — sometimes a single brief peak, months ago, that continues to be charged for long after the day it happened.

That is why reducing total consumption sometimes barely moves the bill. The consumption element falls and the demand element does not, because the peak that set it was a few minutes of simultaneous startup rather than a day of running.

Time-of-use bands add a second effect. The same kilowatt hour costs different amounts depending on when it was drawn, so moving a process by two hours can be worth more than making it more efficient.

None of this is visible on a bill summary. It becomes visible when the tariff is written out as a formula and the consumption data is run through it, which is an ordinary spreadsheet exercise.

Reducing consumption sometimes barely moves the bill, because the peak that set the demand charge was a few minutes of simultaneous startup.

What the work is really about

What Excel Consulting in Buena Vista Usually Involves

Write the tariff out as a formula

The first task is to write the tariff out as an explicit formula, line by line, and it is remarkable how rarely this has been done. Standing charge, consumption rate by time band, demand or capacity charge and how the chargeable demand is determined, any power factor adjustment, levies and pass-through items. Rebuilding last year's bills from that formula and reconciling to the pennies proves you have understood it — and that reconciliation occasionally finds a billing error, which pays for the exercise on its own. Establishing the formula is where Excel consulting on an energy problem starts.

Find the peaks and what caused them

Second, the peaks have to be found and attributed to something that happened. Interval data from the meter, plotted against the production or operating record for the same period, usually identifies the cause quickly: everything starting together at the beginning of a shift, a particular machine cycling at the same time as another, a heating or cooling load coinciding with full production. Once the cause is named, the question becomes whether it can be staggered — and a peak avoided is a charge avoided for the whole period it would have set, which is why this is the highest-return part of the analysis.

Load shifting is usually cheaper than efficiency

Third, and this is counterintuitive to most operators, shifting load is usually cheaper than reducing it. Making a process more efficient takes capital and engineering; running it ninety minutes later takes a scheduling decision. Where a tariff has meaningful time bands or a demand component, rescheduling a controllable load out of the expensive window can produce savings that an efficiency project would need serious investment to match. The model shows which loads are worth moving and what each move is worth, which turns an operational conversation into a ranked list.

Compare tariffs on your own data, not on a brochure

Fourth, alternative tariffs have to be compared on your own consumption data rather than on headline rates. A tariff with a lower unit rate and a higher demand charge is better or worse entirely depending on your load shape, and that cannot be judged from a brochure or a sales conversation. Running your actual interval data through each available tariff formula gives the real annual cost of each, which is the only honest comparison and is frequently the opposite of what the headline rate suggests. That is a contained piece of financial modeling.

Energy cost per unit belongs in the product cost

Fifth, with a real cost per unit of energy established, energy belongs in the product cost rather than sitting in overhead. For an energy-intensive business the energy content of different products varies considerably, and spreading the bill evenly across output hides which products are expensive to make. Attributing it by run time and connected load gives a product cost that reflects reality, and it occasionally shows that an apparently profitable line is thin once its energy is charged to it. Keeping that current is routine Excel reporting.

This is structural rather than a purchase

None of this requires an energy management system. The bills, the interval data your supplier can provide, and the production records hold everything needed. A short session with a year of bills open normally settles it, and the working is yours — which is what Excel expert help covers.

What gets built

Excel Consulting Services in Buena Vista, VA — The Six Areas

Six kinds of work. For an energy-intensive operation, the first and second carry most of the value.

Excel consultant rebuilding an energy tariff as an explicit formula Structure

The Tariff, Written Out as a Formula

Standing charge, consumption by band, demand charge and how it is determined, power factor, levies. Rebuilding last year's bills to the pennies proves it is understood.

  • Tariff as a formula, reconciled against actual bills
  • Billing errors surfaced by the reconciliation itself
  • Formula repair for references that stopped pointing anywhere
  • Performance — volatile formulas replaced with tables and pivots

Related: Excel consulting

Excel model comparing alternative tariffs against actual interval data Modeling

Tariffs Compared on Your Own Load

A lower unit rate with a higher demand charge is better or worse entirely depending on your load shape. Only your own interval data can decide it.

  • Each tariff costed against your actual consumption
  • Load shifting valued load by load
  • Scenario switching across schedules and tariffs
  • Assumptions in one visible block, never inside formulas

Related: Excel financial modeling
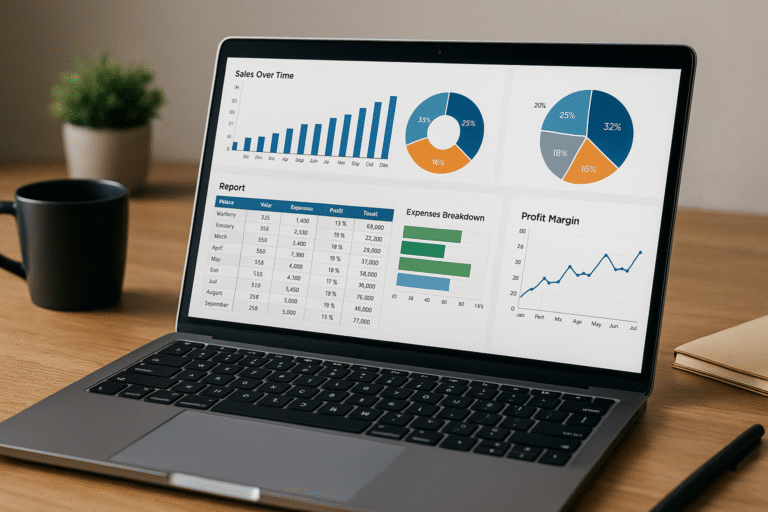
Excel report attributing energy cost per unit by product run time Reporting

Energy in the Product Cost

Spread evenly across output, the bill hides which products are expensive to make. Attributed by run time and connected load, the product cost reflects reality.

  • Cost per unit attributed rather than averaged
  • Peak events reported with the cause beside each
  • Live connections to the systems already holding the data
  • Exception flags when a new peak sets a higher charge

Related: Excel reporting

Automated import of interval meter data against production records Automation

Interval Data Against the Production Record

Meter data arrives in large awkward files and nobody has time to plot it. Imported on a schedule against production, the causes of peaks identify themselves.

  • Scheduled import of interval data and production
  • Import cleanup for meter files that change format
  • Refresh from source rather than from a saved download
  • Peak history so a rising demand trend shows early

Related: Excel automation

VBA routine recalculating bills from interval data under several tariffs Code

VBA to Recost a Year in One Run

Comparing tariffs means recalculating a full year of half-hourly data several times over. A routine that does it, keeps each result and shows the difference.

  • A full year recost under each tariff in one run
  • Results retained so the comparison is auditable
  • Deterministic routines for anything run every period
  • Legacy macro repair where whoever wrote it has gone

Related: VBA and macro development

Remote Excel expert help session with a Buena Vista operation Support

Expert Help and Team Training

Sometimes there is no project, only a renewal offer on the table and no way to judge it. A short session with a year of bills open normally settles it, and the working is yours.

  • Same-week attention when a renewal offer is live
  • Training on your own files rather than on sample data
  • Written handover so the tariff formula stays current
  • Retained hours where there is no in-house Excel depth

Related: Excel expert help and MS Office training

Where it starts

Eight Conversations That Begin a Buena Vista Excel Project

Openings we hear from energy-intensive operations, and what the answer usually turns out to be.

"We cut consumption and the bill barely moved."

Because the demand element did not fall. A brief peak set that charge and it keeps being charged long after the day it happened.

"Nobody here can explain the bill."

Then write the tariff out as a formula and rebuild last year from it. Reconciling to the pennies occasionally finds a billing error too.

"What is causing our peaks?"

Plot interval data against the production record. It is usually everything starting together, or two loads coinciding.

"Efficiency projects are expensive."

Shifting load is usually cheaper than reducing it. Running a process ninety minutes later is a scheduling decision, not a capital one.

"This tariff has a lower unit rate."

Which tells you nothing on its own. A lower rate with a higher demand charge depends entirely on your load shape.

"Energy is just overhead."

Not in an energy-intensive business. Attributed by run time and connected load, some products turn out to be far more expensive to make.

"The meter data is unusable."

It is awkward rather than unusable. Imported and cleaned on a schedule it becomes the most informative data you have.

"Our energy workbook crashes on a year of data."

Half-hourly data is large and whole-column formulas cannot cope. On proper tables a full year recosts in moments.

A quick check

Signs the Energy Bill Is Not Being Managed

Nobody plans this work. It follows a renewal that landed far above expectation. Earlier signals look like this:

  • Nobody can rebuild the bill from the tariff
  • The demand charge is not understood or not separated
  • Peaks are not attributed to anything that happened
  • Interval data has never been plotted against production
  • Tariffs are compared on headline rates
  • Load shifting has never been costed as an option
  • Energy sits in overhead rather than in product cost
  • Nobody can say which half hour set this year's demand charge

What the unmodeled tariff costs

The expensive version is a peak nobody knew they were setting. A few minutes of simultaneous startup fixes a demand charge for the whole following period, and the cost arrives spread across bills in a way that points at nothing in particular.

The quieter cost is a tariff chosen on its headline rate. A supplier offer compared on unit price rather than against your own load shape can be the more expensive option by a wide margin, and nothing in the comparison would have shown it.

What happens before a quote

We look at a year of bills, whatever interval data is available and the production records, and check whether the bills can be rebuilt from the tariff. That reconciliation is the real test.

Frequently the finding is that the tariff formula plus peak attribution settles most of it, and that is the recommendation. Where an engineering change genuinely belongs with your own people, you will be told so. The first conversation is unpaid either way.

Work delivered

Three Builds and the Results Recorded

Real projects for real organizations, each figure as reported by the client after the tool had bedded in.

Excel budgeting template with tiered access across thirty companies

66% better
accuracy

A budget tool across thirty businesses

At the outset
Thirty companies under one management group, each budgeted independently and merged by hand afterward, with several people needing different levels of access to a single file.
What we delivered
A template carrying layered permissions, VBA lifting each approved budget into a master sheet, payroll, tax and benefits adjustable at the front, and totals loading directly into the accounting system.
Afterward
Keying figures twice stopped altogether. Accuracy climbed 66%, the build cycle ran more than ten times quicker, and reforecasting mid-year became something they could do.

Automated report drawing on more than fifty sources

40 hours
a month back

Reporting that had always been manual

At the outset
Internal management reports and submissions to outside funding institutions were built by hand, with one update cycle capable of running to three days.
What we delivered
A program pulling more than fifty sources into one document in roughly five minutes, letting each source be inspected first and turning out drafts for comparison.
Afterward
A job that had filled a working day now finishes in minutes, returning forty person-hours or more every month from effort that produced nothing new.

Workbook rebuilt onto native Excel tables with pivot tables and slicers

9 minutes
to 30 seconds

A file that had become unworkable

At the outset
Finding one row among twelve hundred could take as much as nine minutes, the result of array formulas piled on each other and years of code added without review.
What we delivered
The data rehoused on native Excel tables, pivots and slicers taking over the search logic, and the surplus array formulas and VBA taken out rather than tolerated.
Afterward
Thirty seconds for the same row on the same machine. What had held it back was the arrangement, never the hardware.

Who we work with

Industries We Serve in Buena Vista

The six areas JAAD Group covers, described as they appear where energy is a major cost.

Manufacturing and Logistics icon

Manufacturing & Logistics

Supply chain analysis, production scheduling, vendor performance. Plants whose demand charge is set by simultaneous startup.

Finance and Accounting icon

Finance and Accounting

Cash flow management, P&L tracking, budget analysis. Businesses whose energy sits in overhead rather than in product cost.

Real Estate and Construction icon

Real Estate & Construction

Investment models, cost forecasting, expense tracking. Owners of premises billed on capacity as well as consumption.

Retail and E-commerce icon

Retail and E-commerce

Inventory monitoring, sales tracking, profit calculations. Operations where refrigeration and lighting run around the clock.

Healthcare and Insurance icon

Healthcare & Insurance

Patient record systems, policy tracking, compliance reports. Facilities with continuous environmental and equipment loads.

Education and Training icon

Education & Training

Enrollment reports, course progress dashboards, grant tracking. Providers whose buildings peak sharply on a timetable.

If your industry relies on Excel for financial analysis, data tracking or reporting, we can optimize and automate your workflows to save time and improve performance.

How it runs

Working With an Excel Consultant in Buena Vista

Five stages. The opening one is unpaid, and plenty of enquiries conclude there with guidance rather than a quotation.

  1. Say what you run and how your energy is billed

    And whether a renewal is coming. Sending a year of bills and any interval data makes the call considerably sharper, though it is not required.

  2. We try to rebuild the bills

    From the tariff written out as a formula. If it reconciles, the tariff is understood; if it does not, that gap is the first finding.

  3. Scope and figure, documented

    Both settled before construction. The records have been read by then, so vagueness about either would be a decision rather than a necessity.

  4. Built in view

    Each working version arrives as it is finished rather than everything at the end, which is what makes an early change inexpensive.

  5. Handed over complete

    The workbooks, any code behind them, the tariff written out line by line, and time with whoever will maintain it.

Jeff Mattus, Owner and President of JAAD Group Excel Consulting

Who does the work

Jeff Mattus

Owner & President, JAAD Group

JAAD Group is one person, Jeff Mattus, who put the practice together over more than twenty-five years of Excel and Office systems work and who arrived at the field through Computer Science rather than through a finance department. Where a charge is produced by a formula nobody has written down, that is the instinct that writes it down and tests it.

The projects have reached into finance, healthcare, technology and property. The range is why an opening call usually ends in a diagnosis rather than a discovery phase: a tariff is a rule set applied to interval data, which is an ordinary modeling problem.

Delivery is remote, so a Buena Vista engagement runs exactly as a local one would. Whoever takes the first call prices the job and then builds it.

Organizations we have built for

Trusted With Business-Critical Spreadsheets

CAPTRUST
Trutina
Linmore LED
Gro-Well
McGregor Benefits
The Benefits Academy
Glen Acres HOA
Health Insurance Team
SSIS
OEC
SBA
Jesse Consulting

Why a specialist

Why Buena Vista Businesses Use a Dedicated Excel Consultant

A single discipline

Excel, VBA and Office automation are the entire practice, which is why an opening read is usually accurate and the estimate close to the final number.

Built for the renewal offer

A tariff costed against your own interval data is the only honest comparison, and it is frequently the opposite of what the headline rate implies.

Reshape ahead of rebuild

Where the existing records can be extended rather than replaced, that is the advice, and it is the cheaper route by a wide margin.

Handed over documented

Written explanation, any code and training are part of delivery, so the tariff formula stays current after the build.

Numbers the clients reported

Each outcome quoted above came from the organization running the tool, and all three builds appear at length earlier.

Remote, so it starts at once

Everything happens over a shared screen, so a renewal offer on the table gets attention today.

Questions

Frequently Asked Questions

What does Excel consulting in Buena Vista usually involve?

Most often it is writing the tariff out as an explicit formula and rebuilding last year's bills from it, which proves the tariff is actually understood.

After that it is finding the peaks and what caused them, costing load shifting against efficiency, comparing tariffs on your own data, and putting energy into product cost.

Why did cutting consumption not cut the bill?

Because part of the charge follows consumption and part follows the highest demand you reached. The second part did not change.

A brief peak — often a few minutes of simultaneous startup — can set a charge that continues to be applied long after the day it occurred.

How do you find what caused a peak?

By plotting interval data from the meter against the production or operating record for the same period, which usually identifies it quickly.

The common causes are everything starting together at shift beginning, two machines cycling simultaneously, or a heating or cooling load coinciding with full production.

Is shifting load really cheaper than efficiency?

Usually, and that surprises most operators. Making a process more efficient takes capital and engineering; running it ninety minutes later takes a scheduling decision.

Where a tariff has meaningful time bands or a demand component, rescheduling a controllable load can match savings an efficiency project would need real investment to achieve.

Can we compare tariffs on the unit rate?

No, and doing so is one of the more expensive mistakes available here. A lower unit rate with a higher demand charge is better or worse entirely according to your load shape.

Running your actual interval data through each tariff formula gives the real annual cost of each, and the ranking is frequently the reverse of the headline rates.

Should energy be in the product cost?

In an energy-intensive business, yes. The energy content of different products varies considerably, and spreading the bill evenly hides which ones are expensive to make.

Attributed by run time and connected load, it occasionally shows an apparently profitable line is thin once its own energy is charged against it.

What does an Excel consultant cost?

Scope decides it, which is why the records are examined before any figure is named and why that examination is free. A tariff formula with peak attribution is fixed-price.

In every case the deliverable and the price are agreed in writing before any building begins.

Do you work on site in Buena Vista?

The work is delivered remotely by design rather than by limitation. Going through bills and interval data together on a shared screen is identical at any distance.

It also means a renewal offer on the table gets looked at today, and no part of the invoice is travel.

We do not have interval data. Can we still start?

Yes. The tariff formula and the bill reconciliation can be built from bills alone, and that alone often finds something worth having.

Interval data is usually available from the supplier on request, and it is what the peak attribution needs. Asking for it is a sensible first step either way.

How long does a project take?

A tariff formula reconciled to a year of bills is often a few days. Adding peak attribution, load-shift costing and a tariff comparison usually runs two weeks.

Whatever the size, that estimate is committed in writing before building starts rather than emerging as the work proceeds.

What do we keep at the end?

The workbooks, any macro source code, the tariff written out line by line in plain language, and training for whoever will maintain it.

Nothing is locked to us and no subscription is needed to keep it running. Support afterward is available and entirely optional.

Are those six industries a limit?

No. They describe where most of the work has come from rather than what is accepted, and what decides scope is the nature of the problem rather than the sector.

A process load, a refrigeration load and a building's heating all meet the same tariff and respond to the same analysis.

Also serving

Excel Consulting Across Virginia

Everything is delivered over a shared screen, so your address has no bearing on the result. Other Virginia cities with their own pages:

By service: Excel consulting for the tariff formula, financial modeling for tariff comparison, Excel reporting for peaks and product cost, Excel automation for interval data, and VBA and macro development or Excel expert help for the rest.

Buena Vista is the hub here — schematic, not to scale

Send Us the Workbook

Tell us what you run and how your energy is billed, or attach a year of bills and any interval data. You get a flat read on where the cost is made, with nothing committed.

949-464-7489

JAAD Group Excel Consulting · 2937 Hawksdale Dr, Las Vegas, NV 89134
Excel consulting services in Buena Vista, VA and across Virginia, delivered remotely