
Turn Your Data into Clear, Live Excel Dashboards
Your numbers are spread across files, systems, and reports. We build one Excel dashboard that pulls them together, so you can see sales, cash, and performance at a glance and act on them the same day.
What Is an Excel Dashboard?
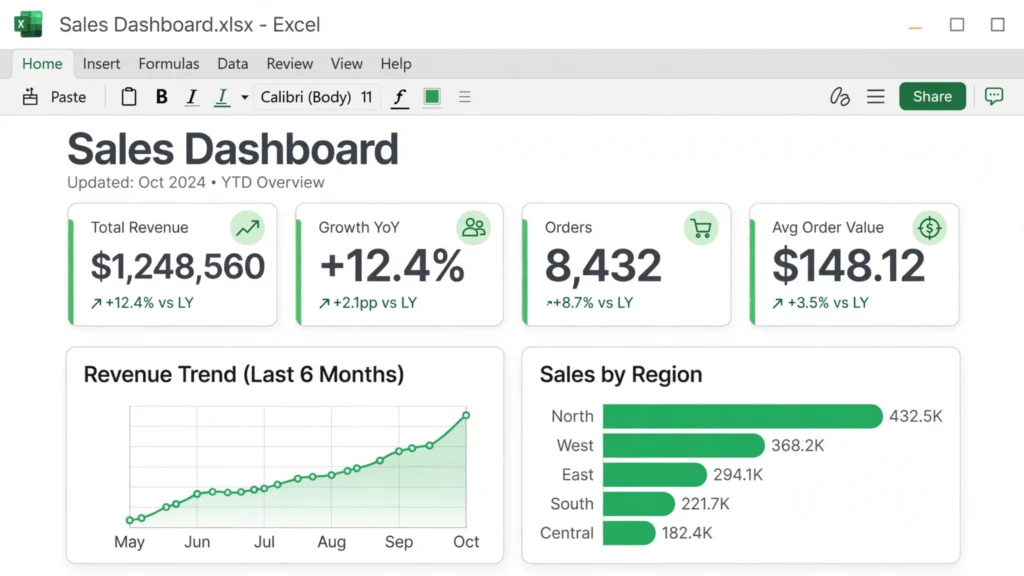
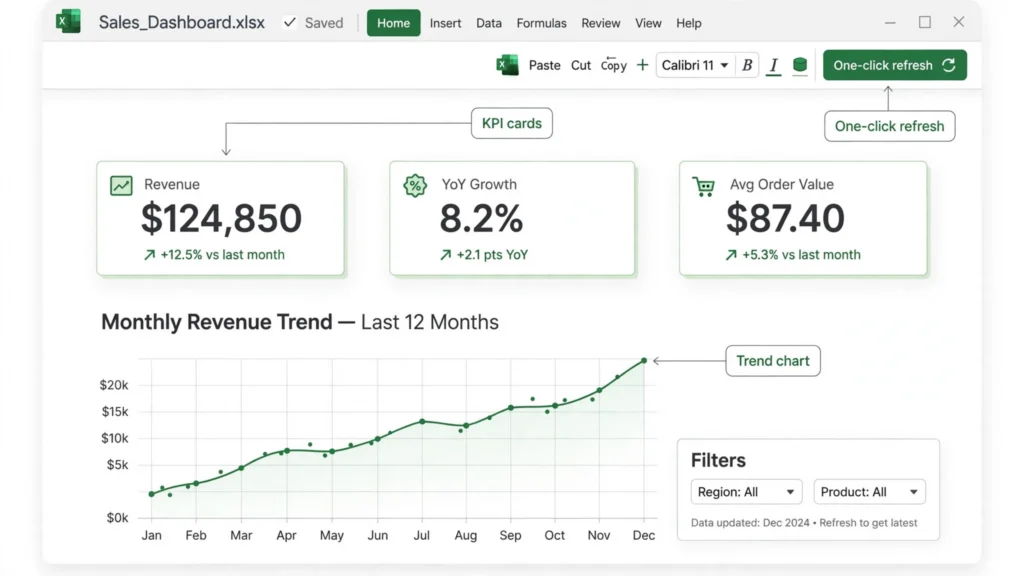
An Excel dashboard is a single page that shows your most important numbers in one place. KPIs, charts, and tables update from your data, so you stop hunting through files and start deciding. Unlike a static report, a dashboard is built to be opened every day. It answers the questions you ask most often: how are sales doing, where is the money going, and what needs attention this week.
A good dashboard does more than look clean. It is built on structured data, clear formulas, and the right KPIs for your business. That is why our dashboards sit next to our Excel reporting work: the dashboard shows the numbers, and the reporting behind it keeps them accurate.
What We Offer in Excel Dashboard Services
Every dashboard is built for the way your business actually runs. We start with your data and your decisions, then design the dashboard around them. Our Excel automation skills keep the manual work out, so the dashboard stays fresh without extra effort from your team.
KPI Dashboards
The handful of numbers that run your business, on one page. Sales, margins, cash, and targets, with clear targets and trend arrows.
Sales Dashboards
Pipeline, revenue by product or region, and rep performance. See what is selling, what is stalling, and where to push next.
Financial Dashboards
Cash flow, budgets against actuals, and profitability by line of business. Built on the same discipline as our financial modeling work.
Operations Dashboards
Inventory, orders, deliveries, and team workload. Spot bottlenecks before they become missed deadlines.
Executive Dashboards
A one-page view for leadership. The numbers that matter, without the detail that belongs in the underlying reports.
Dashboard Refresh and Repair
Already have a dashboard that broke, slowed down, or stopped matching your reports? We fix the formulas, reconnect the data, and restore the layout.
Examples of Dashboards We Can Create
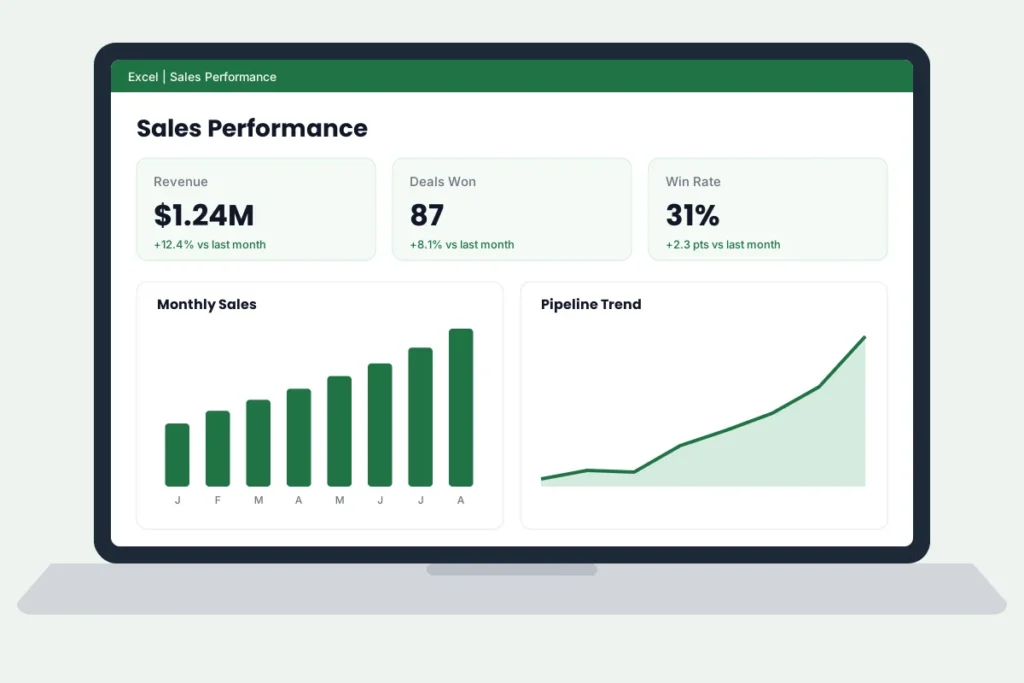
Sales and KPI Dashboards
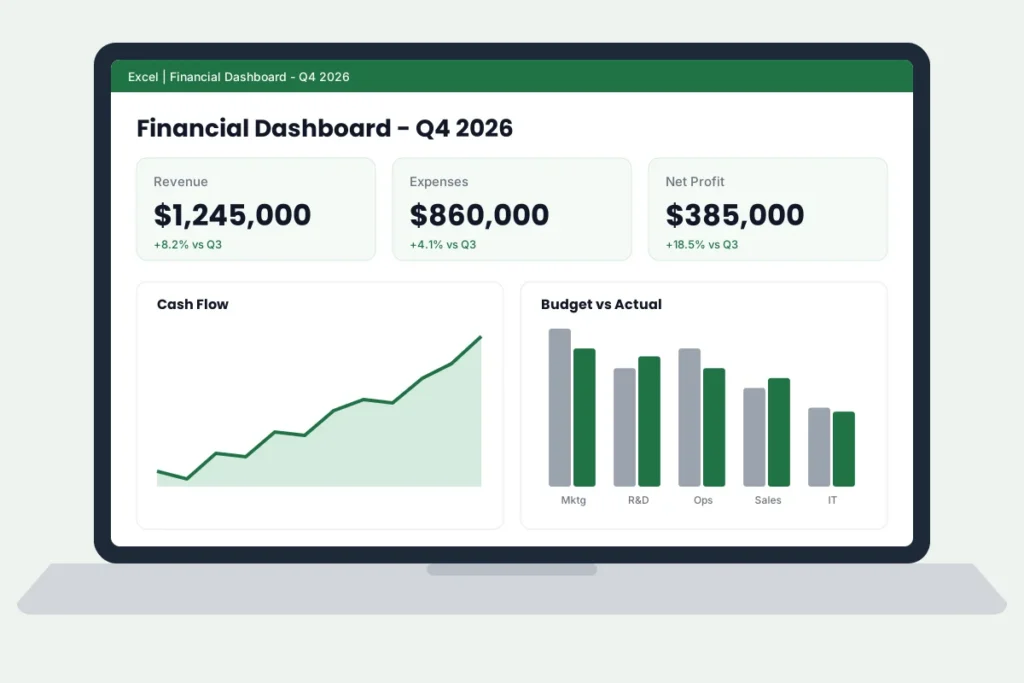
Financial Dashboards
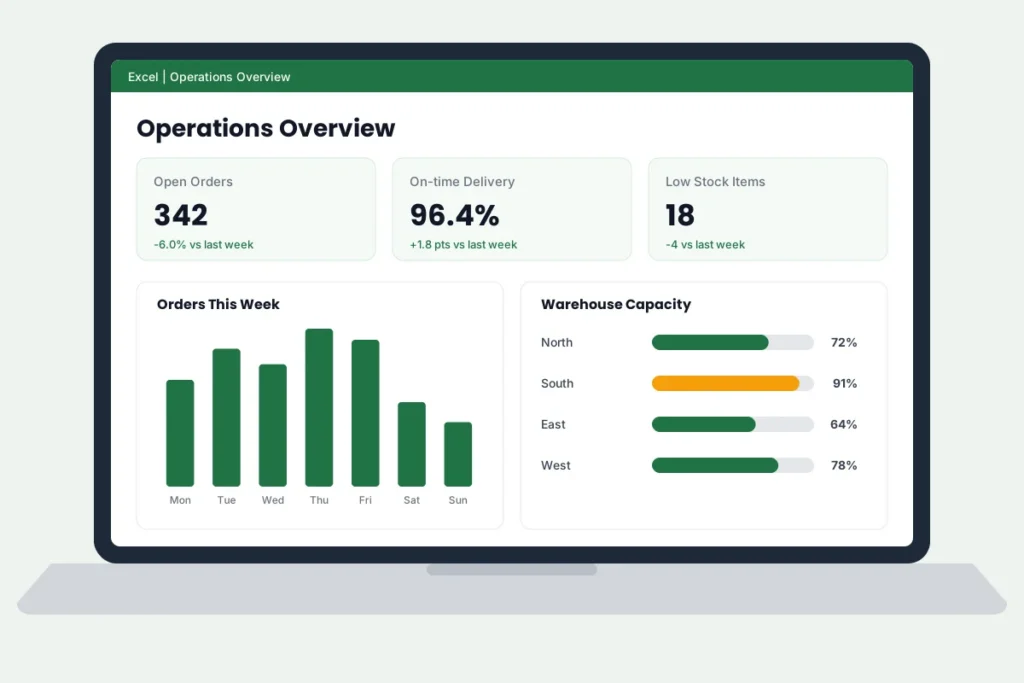
Operations Dashboards
Industries We Help with Excel Dashboards
Dashboards work in any business that runs on numbers. These are the industries we help most often.

Finance and Accounting

Retail and E-commerce

Healthcare and Insurance

Manufacturing and Logistics

Real Estate and Construction
Nonprofits

Why Dashboards Matter for Your Business
Decisions faster
When the numbers are always in front of you, you stop waiting for month-end reports and act the same day.
Problems caught early
A dip in sales or a spike in costs shows up straight away, so small issues get fixed before they grow.
One source of truth
Everyone looks at the same dashboard, so your team stops arguing about which file is right.

Meet Your Consultant
Your dashboard is built by Jeff Mattus, founder of JAAD Group Excel Consulting, with over 25 years of experience in Excel, financial modeling, and automation. Jeff works directly with every client, from the first call to the finished dashboard.
Why Choose JAAD Group Excel Consulting
At JAAD Group Excel Consulting, we build tools your team will actually open every day. No bloated files, no fragile formulas, and no dashboard that only its builder understands.
- Built on clean data. Every dashboard starts with structured, checked data, so the numbers you see are the numbers you can trust.
- Made for daily use. Simple navigation, clear labels, and one-click refresh. If your team needs training, we show them how it works.
- Fixed price, quoted upfront. You know the cost before work starts, and the first call is free.
- Support after delivery. If your data changes or your KPIs change, we adjust the dashboard with you.
Our Step-by-Step Process
1. Understand your numbers.
A free first call to learn what you measure, where your data lives, and which decisions the dashboard must support.
2. Pick the right KPIs.
Together we choose the handful of metrics that actually drive your business, and leave the rest out.
3. Build the dashboard.
We connect your data, build the formulas and charts, and design a clean one-page layout.
4. Test and refine.
You try it with your real data. We fix anything unclear and adjust the layout until it reads at a glance.
5. Train your team.
A short walkthrough so your team can refresh the data, read the KPIs, and keep the dashboard current.
Rated 5-Star by Our Clients
JAAD Group Excel Consulting holds a 5.0 rating on Google, based on 9 reviews.
“JAAD far exceeded my expectations! Jeff is an expert in Excel Automation and Excel Programming.” (Ashley Merz, September 2025, Chamber of Commerce)
Excel Dashboards, Common Questions
What is an Excel dashboard?
An Excel dashboard is a single page that shows your most important numbers in one place. KPIs, charts, and tables update from your data, so you can see performance at a glance instead of opening many files.
How long does it take to build an Excel dashboard?
It depends on how many data sources and KPIs the dashboard needs. A simple dashboard can be ready in a few days. A larger one takes longer. You get a fixed timeline before work starts.
Will my dashboard update automatically?
Yes. Dashboards can pull from your existing files and refresh with one click. Where it helps, we use Power Query so new data flows in without copy and paste.
Can you rebuild my existing dashboard?
Yes. If your dashboard broke, slowed down, or stopped matching your reports, we fix the formulas, clean the data connections, and make it reliable again.
Do I need Power BI for a dashboard?
Most teams do not. An Excel dashboard covers KPIs, charts, and live updates, and your team already knows Excel. If your team outgrows Excel later, we can talk about the next step.
How much does an Excel dashboard cost?
Every dashboard is quoted as a fixed price after a free first call. A quote is given after looking at your data and what you need, not before. The first call costs nothing.
Let’s Build Your Dashboard
Tell us what numbers you need to see every day. We will show you what your dashboard can look like and quote a fixed price. The first call is free.