
I get this question regularly, and it almost always comes from the same place. A business has been running on Excel for years. Things are working, more or less. Then someone on the team discovers Power BI, or their IT department suggests it, or a consultant tells them they should be using it. Suddenly they are wondering whether the tool they have built everything on is the wrong one.
Let me give you an honest answer based on 25 years of working with both tools and with the businesses that use them.
Excel and Power BI are not competitors. They are different tools built for different purposes, and the businesses that get the most value from their data are usually the ones that understand exactly where each one belongs.

What Each Tool Is Actually Built For
Excel has been the default business analysis tool since the 1980s. It is a spreadsheet application built for data entry, calculations, financial modeling, and ad hoc analysis. It is flexible, familiar to almost everyone in a business environment, and capable of serious analytical work when used properly. It runs on your desktop, stores data in a file, and gives you complete control over every cell.
Power BI is Microsoft’s business intelligence platform, built for connecting multiple data sources, creating interactive dashboards, and distributing reports to large teams from a single source of truth. It is designed for structured, recurring reporting at scale. It lives in the cloud, refreshes automatically, and is built around the assumption that multiple people need to look at the same data consistently.
The distinction matters because choosing the wrong tool for your situation does not just create inconvenience. It creates technical debt, wasted investment, and reporting processes that are harder to maintain than the ones they replaced.
Where Excel Wins
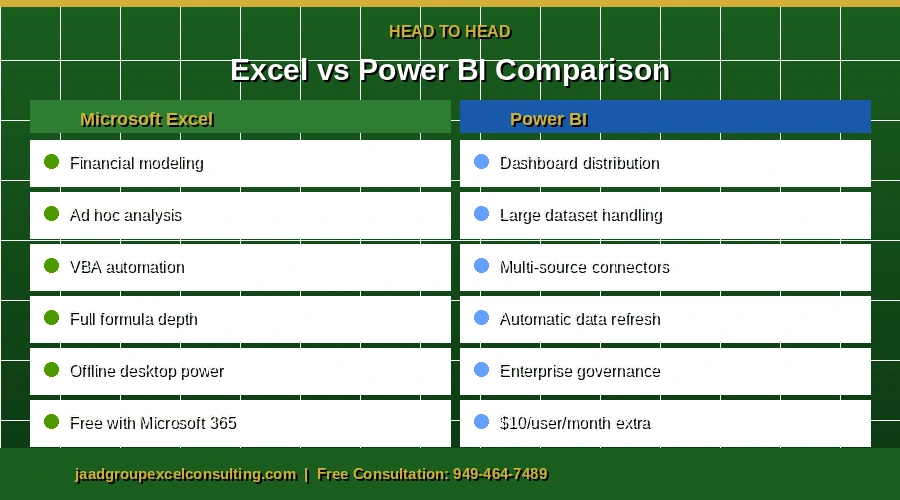
Financial modeling and complex calculations. Excel remains the industry standard for financial modeling, and there is a reason for that. The formula library is deep, the modeling structure is flexible, and the output can be precisely controlled. If you are building a 3-statement financial model, a budget vs. actual variance analysis, or a cash flow forecast that a CFO or investor needs to review, it belongs in Excel. Power BI has DAX for calculations, but it is not designed for the kind of line-by-line financial modeling that serious finance work requires.
Ad hoc analysis. When someone needs to quickly pull a dataset, run some calculations, test a hypothesis, or answer a one-off business question, Excel is faster and more intuitive than Power BI. There is no data model to set up, no relationships to define, no report canvas to build. You open the file, work with the data, and get an answer. For analysis that does not need to be repeated or distributed widely, Excel is simply more practical.
Custom automation with VBA. Excel’s VBA capability allows you to automate complex, business-specific processes in ways that Power BI cannot. If your reporting workflow involves custom data cleaning, specific formatting logic, file management, or process automation that goes beyond standard dashboard publishing, Excel with VBA handles it. Power BI has no equivalent.
Flexibility and control. Every cell in Excel is yours to control. You can build exactly what you need, structure it exactly as your business requires, and modify it without going through a data model or a report layout. For businesses with unique or non-standard reporting needs, this flexibility is a significant advantage.
Accessibility and familiarity. Almost everyone in a business environment already knows how to use Excel at some level. Training costs are low, adoption is immediate, and there is no learning curve for the people who need to use the output. Power BI requires understanding data modeling concepts, DAX calculations, and a new interface before anyone can build something useful.
Where Power BI Wins
Large datasets. Excel handles up to approximately one million rows per sheet. For businesses processing millions of records, that limit is a real constraint. Power BI can handle datasets far beyond what Excel can manage without performance degradation. If your data volume is pushing against Excel’s limits, Power BI is the right infrastructure.
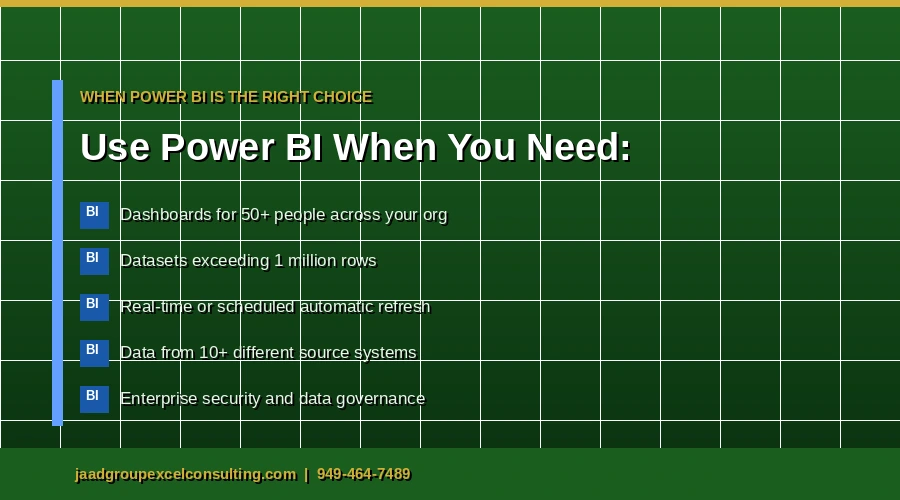
Interactive dashboards for large audiences. If you need to publish a report that 50 people across your organization can access, filter, and interact with simultaneously, Power BI is built for that. Excel reports distributed by email create version conflicts, go stale the moment they are sent, and give each recipient a static snapshot. Power BI reports live in the cloud, refresh on a schedule, and give every user access to the same current data through a browser or mobile app.
Connecting multiple data sources. Power BI connects to over 200 data sources including cloud databases, CRM systems, ERP platforms, and APIs. If your business needs to pull data from five different systems into a single dashboard, Power BI handles that consolidation more cleanly than trying to manage it through Excel connections.
Scheduled automated refresh. Power BI reports can be set to refresh automatically on a schedule — hourly, daily, or near real-time depending on the data source. The moment your source data updates, the report reflects it without anyone touching a file. For operational dashboards that need to be current throughout the day, this is a significant advantage over Excel.
Enterprise security and governance. For businesses with compliance requirements or sensitive data, Power BI’s row-level security, Azure Active Directory integration, and centralized data governance are advantages that Excel’s file-based model cannot match.
The Honest Decision Framework
Here is how I think about which tool belongs where.
If the output is a financial model, a budget, a forecast, or any calculation-heavy document that one person or a small team will use to make decisions, it belongs in Excel. The formula depth, the flexibility, and the control Excel provides are exactly what that work requires.
If the output is a dashboard that a large team or an entire organization needs to view consistently, that refreshes automatically, and that needs to pull from multiple data sources, it belongs in Power BI.
The mistake I see most often is businesses trying to use Excel to do what Power BI is designed for. Building sprawling Excel dashboards that break every time the data structure changes. Distributing reports by email and then spending half a day reconciling why different people have different numbers. Managing version control on files that five people have modified simultaneously.
The inverse mistake is also common. Businesses that move everything to Power BI and then find that the finance team cannot build the flexible models they need, or that ad hoc analysis requires spinning up a full report instead of just opening a file and working with the data.
Both tools have a place. The question is where.
Can You Use Both
Yes, and this is exactly what most well-run businesses do.
A practical setup is to use Excel for financial modeling, ad hoc analysis, and any process that requires the flexibility and calculation depth that Excel provides. Use Power BI for operational dashboards, company-wide reporting, and any situation where you need current data distributed to a large audience automatically.
The two tools are designed to work together. Power BI can connect directly to Excel files as a data source. Excel can pull from Power BI datasets. Data teams prepare the underlying data once and both tools can consume it without duplication.
Where Excel Consulting Fits In
One thing worth saying directly: most businesses that struggle with their Excel setup are not struggling because they need to switch to Power BI. They are struggling because their Excel setup is poorly built.
Reports that take too long to run are usually built on manual processes that should be automated. Dashboards that break every month are usually built without proper table structure and dynamic references. Financial models that nobody trusts are usually built without validation checks and clear audit trails.
Before a business invests in a new tool, it is worth asking whether the problem is the tool or the implementation. In most cases I see, the implementation is the issue. A well-built Excel system with proper automation handles the reporting needs of most small and mid-sized businesses without the cost and complexity of a Power BI deployment.
If your business is at a point where you are genuinely pushing against Excel’s data volume limits, or where you need real-time dashboards distributed to a large organization, that is when Power BI makes sense. If you are not at that point, the right investment is getting your Excel setup built properly.
At JAAD Group, I work with businesses at exactly this decision point. Whether that means building the Excel automation system that eliminates your manual reporting work, or advising on when Power BI is genuinely the right next step, the goal is always the same: a reporting setup that works reliably for your specific business without unnecessary complexity or cost.
A free consultation starts with understanding your current situation before recommending anything.
Call JAAD Group: 949-464-7489 Visit: jaadgroupexcelconsulting.com