

Let me be straight with you. Finance runs on Excel. That is not an opinion it is a fact backed by data. A 2025 survey by the Association for Financial Professionals found that 96% of FP&A professionals use Excel every single day. Not occasionally. Every single day.
But here is what I see over and over again working with finance teams: most of you are using maybe 30% of what Excel can actually do. You are spending hours on manual data entry, copy-pasting between sheets, and rebuilding the same reports month after month. The tool is not the problem. How it is being used is the problem.
I have spent over 25 years helping finance teams fix exactly that. This guide covers the formulas that actually move the needle, the models your team should already have, and the automation strategies that will give you your time back.
The Formulas Every Finance Professional Needs to Know
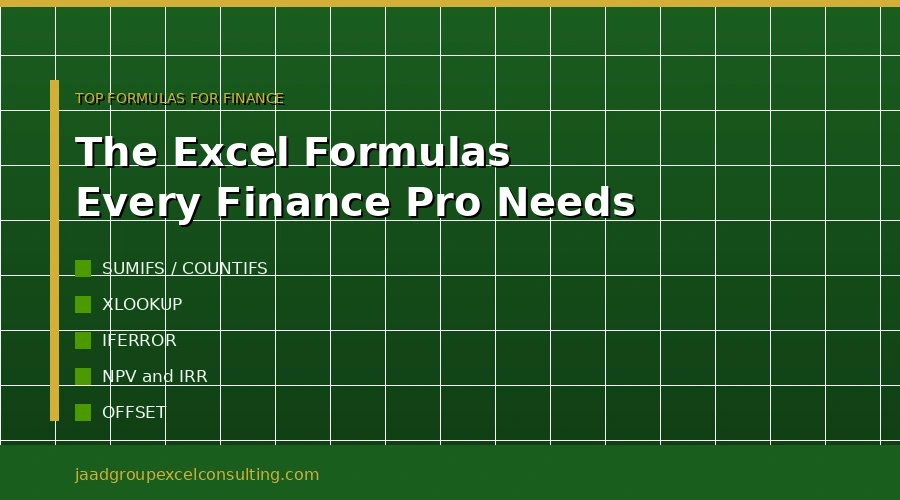
SUMIFS and COUNTIFS
If you are still using SUMIF with a single condition, you are leaving a lot of capability on the table. SUMIFS lets you total values across multiple conditions at once. Calculating total revenue for the North region in Q2 2025? That is one formula, not a pivot table with three filters. For finance teams running regional or product-level forecasts, SUMIFS is one of the most practical Excel formulas for financial analysis you will touch every single day.
VLOOKUP and XLOOKUP
VLOOKUP has been a finance staple for decades. It works. But XLOOKUP, available in newer Excel versions, is better in almost every way. It searches in both directions, handles errors without extra wrapping, and does not fall apart when someone inserts a column. If your team is still building new models on VLOOKUP, start transitioning to XLOOKUP now. Future you will be grateful.
IFERROR
This one is simple and most people underuse it. Instead of letting error messages spread through your consolidated statements, IFERROR lets you control what happens when a formula fails usually returning a zero or a blank. One broken input should not cascade through an entire model. IFERROR stops that from happening, and it keeps your Excel financial modeling outputs clean and readable. For a deeper breakdown, here are the most effective Excel functions for FP&A used by finance teams today.
IF, AND, OR and how to combine them
A basic IF statement is fine for simple logic. But when you combine IF with AND or OR, you can test multiple conditions at once. lFagging a line item only when revenue falls below target and margin drops below a threshold at the same time. This is the foundation of dynamic financial models that actually respond to business conditions instead of needing manual updates every cycle.
OFFSET for rolling calculations
OFFSET is one of those functions that most finance professionals have heard of but few use well. It returns a range of cells a set number of rows and columns away from a reference point. Combined with SUM or AVERAGE, it is essential for rolling calculations trailing twelve-month averages, year-to-date totals, forecast ranges that expand automatically as new periods come in. This is what separates a model that genuinely scales from one that needs to be rebuilt every quarter.
NPV and IRR
If your team is doing any capital budgeting or investment analysis and you are not using Excel’s built-in NPV and IRR functions, you are making the work harder than it needs to be. What matters is understanding the inputs well the discount rate assumptions for NPV and what IRR is actually calculating so your results hold up when a CFO or board member pushes back on the numbers.
The Models Every Finance Team Should Have Built
3-Statement Financial Model
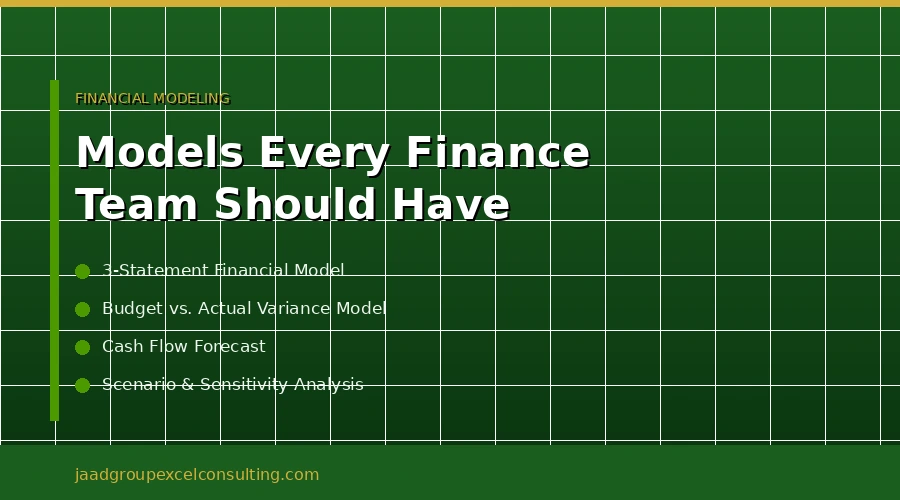
The foundation of serious Excel financial modeling is a properly linked three-statement model income statement, balance sheet, and cash flow statement where every number flows automatically. When inputs change, everything updates. When the balance sheet goes out of balance, you know immediately rather than three weeks later when someone finds the mistake.
Most finance teams I work with have fragments of this. A partial income statement here, a standalone cash flow there. Very few have it built cleanly with assumptions separated from outputs and a clear audit trail through the formulas. A well-built 3-statement model does not get rebuilt every budget cycle. It gets updated. That is a completely different experience.
Budget vs. Actual Variance Model
Every finance team produces this report. The question I always ask is: how long does it take you, and how much of that time is actual analysis versus moving data around?
A well-structured Excel budget model pulls actuals from a consistent source, compares them automatically against plan, calculates variance in dollar and percentage terms, and flags exceptions without anyone touching a formula. Built correctly, this report should take minutes to produce. If it is taking your team a day or more, that is time worth recovering.
Cash Flow Forecast
I see this done manually more than any other model pulling bank balances, entering receivables by hand, estimating payables from memory. Done with proper Excel automation, the model connects to your source data, updates on a schedule, and produces a rolling 13-week or 12-month view without a team member spending hours assembling it. For growing businesses where cash timing is as important as profitability, this is not a nice-to-have.
Scenario and Sensitivity Analysis
A static model answers one question. A scenario model answers three: what happens if things go as planned, better than expected, or worse. Sensitivity analysis goes further showing you how a specific output like net income or cash runway changes as one input variable moves across a range.
Excel’s data tables handle this natively. A one-variable data table can show you how different revenue growth assumptions affect operating income across an entire range in a single view. For businesses making significant capital decisions, this is not optional. It is how you make confident decisions when the future is uncertain which is always.
Where Your Finance Team Is Losing the Most Time
Month-end close that drags on too long
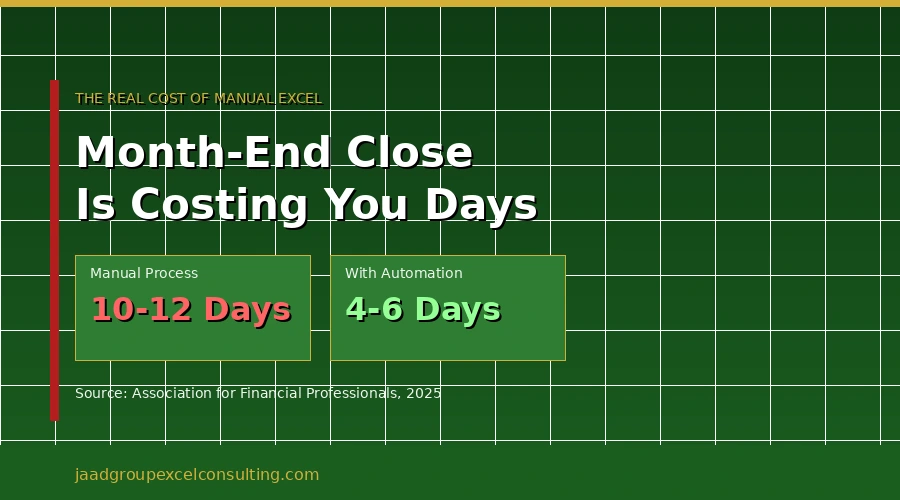
Research from 2025 shows that finance teams running manual Excel processes average 10 to 12 days for month-end close. Teams with proper Excel automation bring that down to 4 to 6 days. The difference is not effort. It is eliminating the steps where data gets manually moved from one place to another.
Power Query handles data consolidation and connects directly to your source systems accounting software, databases, ERP exports and refreshes automatically. VBA handles the repetitive formatting and distribution tasks. What used to take a full morning becomes a two-minute process.
Reports that break every single month
If your monthly reporting workbook requires someone to go in and manually update references, adjust date ranges, or re-link data every cycle that is not a report. That is a recurring project in disguise. A properly built Excel reporting model uses dynamic references, named ranges, and automated refresh logic so that opening the file and pressing one button is the entire process.
The one person who knows how everything works
Every finance team has this person. They built the model, they know where everything lives, and they are the only one who can fix it when something breaks. I am not saying this to criticize it happens in almost every team I work with. But it is a model structure problem, not a people problem.
Well-built Excel financial models are documented, structured with clear input-calculation-output separation, and readable by someone who did not build them. When that is not the case, one resignation or one sick week creates a serious operational risk.
Consolidating data across multiple files by hand
For businesses with multiple entities, departments, or regions, manually consolidating Excel files is one of the most error-prone and time-consuming processes in finance. VBA macros can automate this entirely pulling data from multiple workbooks, consolidating into a master file, and producing consistent output without anyone touching the files manually.
Structure First Everything Else Follows
Before we talk about any formula or automation, I want to make one thing clear: the structure of your model determines whether everything else works. I have seen highly sophisticated models fall apart because the fundamentals were not in place.
Here is what the fundamentals look like. Inputs, calculations, and outputs on separate sheets or clearly defined sections. Assumptions never hard-coded directly into formulas they belong in a dedicated area where they are visible, easy to change, and auditable. Named ranges instead of cell references wherever possible. Color-coding for inputs, formulas, and outputs so that anyone reviewing the model knows exactly what they are looking at.
These are not cosmetic choices. They are the difference between a model that holds up under scrutiny and one that produces a costly error months after it was built. I have seen both outcomes. Structure is the one thing that determines which one you get.
When It Makes Sense to Bring in Outside Help
Most finance teams learned Excel on the job. You know enough to build reports that work until they do not. The gap between what your team can build and what you actually need is usually less about skill and more about time and experience with the specific structures that complex models require.
Bringing in an Excel consultant makes sense when the model you are building will carry significant financial decisions, when your current setup is fragile and breaks more often than it should, when consolidation processes are eating too much of your team’s time, or when you need automation that goes beyond what your team has tackled before.
At JAAD Group, I work directly with your finance team. Every project whether it is a 3-statement model, an automated reporting system, or a full VBA automation build is handled by me personally. Not passed to someone junior. Not templated. Built around how your business actually works.
If your team is spending more time managing spreadsheets than analyzing what is inside them, that is worth a conversation. A free consultation starts with understanding your current setup before I recommend anything.
Call JAAD Group: 949-464-7489 Visit: jaadgroupexcelconsulting.com