

Let me tell you something I see constantly. A business owner or finance manager sits down on Monday morning, opens Excel, and spends the next two to three hours doing the exact same thing they did last Monday. Download the data. Paste it in. Fix the formatting. Refresh the pivot table. Update the charts. Send the report.
They do this every single week. Every single month. Sometimes every single day.
The work itself is not hard. It is just repetitive. And repetitive manual work is exactly what Excel was built to eliminate, if you know how to set it up properly.
After 25 years of building and automating Excel reporting systems for businesses across finance, real estate, healthcare, and operations, I can tell you that most teams are one good automation setup away from getting hours of their week back. This guide walks you through how to do it.
Why Manual Excel Reporting Is Costing You More Than You Think
Before we get into the how, I want to make sure the why is clear.
Every time someone manually copies and pastes data into a report, there is a chance for a mistake. A wrong cell. A missed row. A number that did not update. These mistakes are not just inconvenient. In financial reporting, they can be costly. Research shows that up to 88% of spreadsheets contain at least one error, and the majority of those errors come from manual data handling.
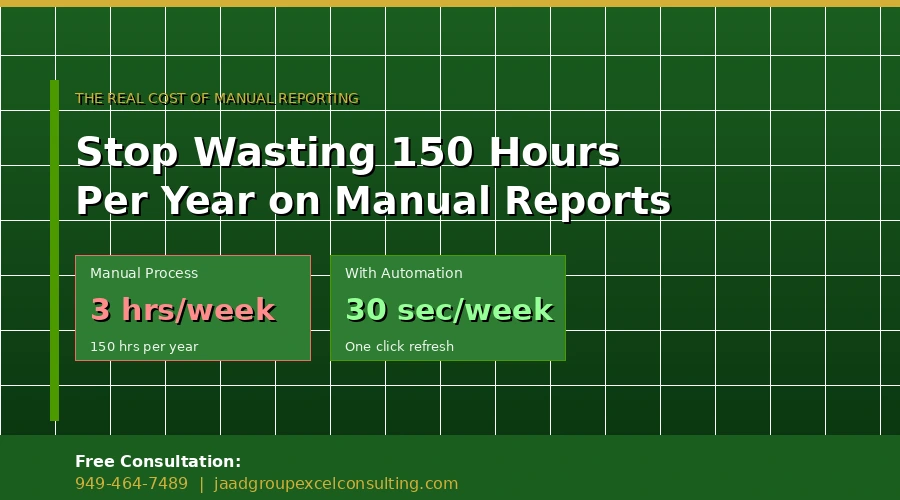
Beyond the error risk, there is the time cost. If someone on your team spends three hours every week building the same report, that is 150 hours per year. For a business owner or senior analyst, that time has a real dollar value. And it is being spent on assembly, not analysis.
Automation fixes both problems at once.
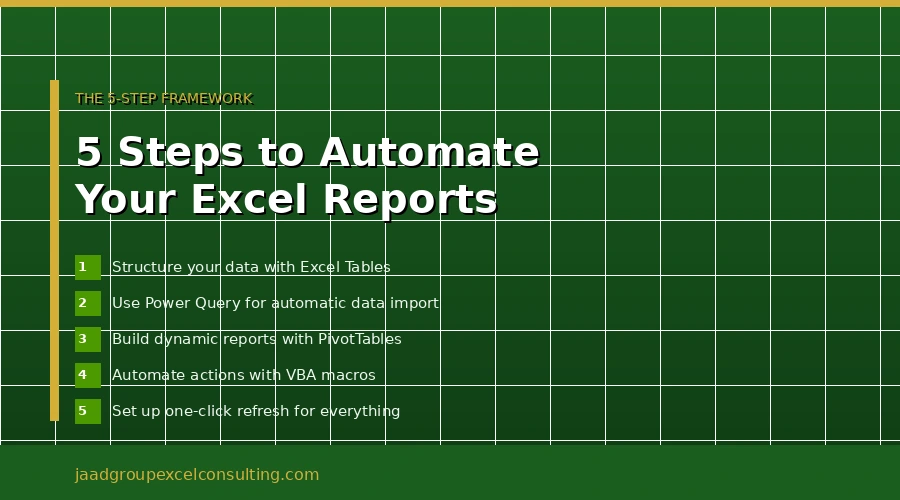
Step 1: Structure Your Data Correctly Before You Automate Anything
This is the step most people skip, and it is the one that determines whether everything else works.
Before you add any automation, your data needs to follow a consistent structure. That means one row per record, consistent column headers that never change, no merged cells, no summary rows mixed in with raw data, and no blank rows breaking up the dataset.
The single most important structural change you can make is converting your data ranges into Excel Tables. Go to your data, click anywhere inside it, and press Ctrl+T. Excel will ask you to confirm the range and whether your data has headers.
Once your data is in a Table, everything downstream updates automatically. Formulas extend to new rows. PivotTables refresh to include new data. Power Query picks up new records without any changes to the connection. This one step removes a significant amount of the manual maintenance that most teams spend time on every month.
Step 2: Use Power Query to Automate Data Import and Cleanup
Power Query is the most underused tool in Excel. It is built directly into Excel under the Data tab, and it does something that saves enormous amounts of time: it records every data cleaning step you take and replays them automatically every time you refresh.
Here is what that means in practice. Your team receives a CSV export from your accounting system every month. It has extra columns you do not need, blank rows scattered through it, inconsistent date formats, and column names that change slightly depending on who pulled the report.
Without Power Query, someone spends 30 to 45 minutes cleaning that file every single month.
With Power Query, you clean it once. You connect to the file, remove the columns you do not need, filter out the blank rows, standardize the date format, and rename the columns. Power Query records every one of those steps. Next month, you drop the new file in the same folder, open Excel, click Refresh, and every cleaning step runs automatically in seconds.
To set this up, go to the Data tab, click Get Data, and choose your source. If you are working with CSV files or Excel workbooks, navigate to your file and open it in the Power Query Editor. Apply your cleaning steps, and then click Close and Load to bring the cleaned data into your workbook. From that point forward, refreshing the connection reruns all of your steps automatically.
Power Query also handles combining multiple files from the same source. If you have 12 monthly sales reports saved in one folder, Power Query can consolidate them into a single dataset automatically, adding a column to identify which file each row came from.
Step 3: Build Dynamic Reports That Update Themselves
Once your data is structured and your Power Query connections are set up, the next step is making sure your reports respond to new data without manual intervention.
PivotTables are the fastest way to do this. Right-click your PivotTable and select Refresh, or go to Data and click Refresh All to update every connection and PivotTable in the workbook at once. If your source data is in a Table, the PivotTable will automatically include any new rows that have been added.
For formulas, use structured references instead of cell references wherever possible. Instead of writing =SUM(B2:B500) and hoping your data never exceeds 500 rows, write =SUM(Table1[Revenue]) and it will always include every row in the Revenue column, no matter how many rows you add.
Dynamic array functions like FILTER, SORT, and UNIQUE, available in Excel 365, take this further. A single FILTER formula can replace a manual filter applied to a range, and it updates automatically whenever the underlying data changes.
For date-based reporting, use named ranges or helper columns that calculate the current month, quarter, or year automatically using TODAY() and functions like MONTH(), YEAR(), and EOMONTH(). This means your monthly reports do not need date ranges updated manually each cycle.
Step 4: Automate Repetitive Actions with VBA Macros
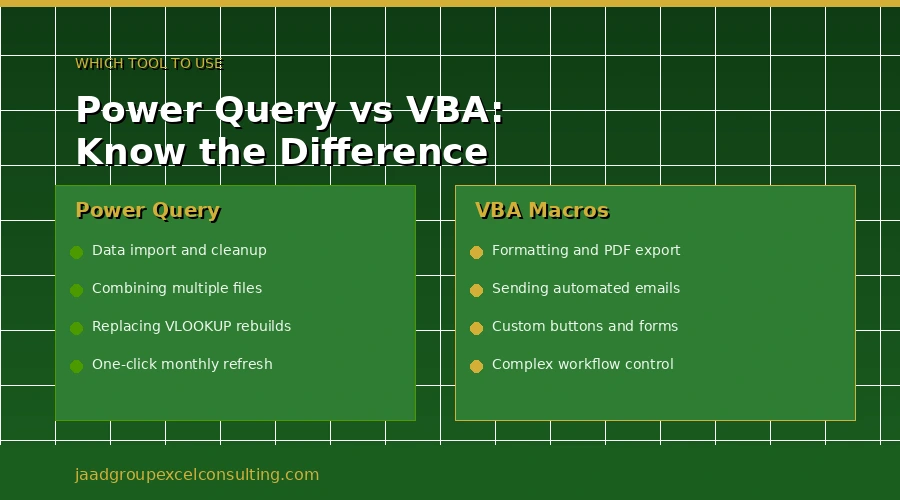
Power Query handles data. VBA handles actions.
If your reporting process involves steps beyond data transformation, such as formatting cells a specific way, saving the report as a PDF, copying a sheet to a new workbook, or sending an email with the finished report attached, VBA is the tool that automates those steps.
The easiest way to start with VBA is the Macro Recorder. Go to the Developer tab (if you do not see it, go to File, Options, Customize Ribbon, and check the Developer box). Click Record Macro, give it a name, and perform the steps you want to automate. When you are done, click Stop Recording. Excel has converted everything you did into reusable VBA code.
You can then run that macro with a single click, assign it to a button on your worksheet, or trigger it automatically when you open the workbook.
For a practical example, here is what an automated monthly reporting macro might do in sequence. Refresh all Power Query connections. Update all PivotTables. Apply the standard formatting template to the output sheet. Save a copy of the report as a PDF with the current month and year in the filename. That entire sequence, which might take 20 minutes manually, runs in under 30 seconds.
One important distinction: Power Query is for data transformation. VBA is for everything else. Use both together and you cover the full reporting workflow from data import through to final output.
Step 5: Set Up One-Click Refresh for the Whole Workbook
Once everything is built, the goal is to make running the report as simple as clicking one button.
Create a simple macro that refreshes everything in the correct order. First the Power Query connections, then the PivotTables, then any calculations that depend on the refreshed data. Assign this macro to a button on a control sheet or the top of your dashboard.
Here is what that looks like in practice. Your team receives the monthly data file. They drop it in the designated folder. They open the reporting workbook and click one button. In 15 to 30 seconds, every table, chart, and summary in the workbook is updated and ready to share.
That is what a properly automated Excel reporting system looks like. The manual work is gone. The only step left is making the decision about what the updated numbers mean.
The Most Common Automation Mistakes I See
After building these systems for 25 years, I see the same mistakes come up repeatedly.
Building automation on top of poorly structured data is the biggest one. If your source data has inconsistencies, merged cells, or irregular formatting, automation amplifies those problems rather than solving them. Structure first, automate second.
Hard-coding values that should be dynamic is the second most common issue. If your automation references specific cell addresses or date ranges that need to be updated manually each month, you have not actually automated anything. Use table references, named ranges, and formula-driven date logic.
Building something that only one person can run or maintain is also a consistent problem. I see systems where the macro breaks if the wrong person touches it, or where the Power Query connection only works on one specific computer. Build for the team, not for yourself. Document what you built and make sure more than one person understands how it works.
When to Build It Yourself vs When to Bring in Help
If your reporting needs are straightforward, the steps above will get you most of the way there. Excel Tables, Power Query, and a simple macro cover the majority of common reporting automation for small and mid-sized businesses.
Where it makes sense to bring in outside help is when the automation needs to connect to external systems, when the logic is complex enough that getting it wrong has real consequences, when previous attempts have produced something fragile that keeps breaking, or when your team simply does not have the time to build it properly.
At JAAD Group, I build Excel automation systems exactly like the ones described in this guide. Every project is handled personally by me, built around how your specific business runs, and handed over with documentation so your team can operate it confidently from day one.
If your team is spending hours every week on a report that should take minutes, that is worth a conversation.
Call JAAD Group: 949-464-7489 Visit: jaadgroupexcelconsulting.com